
Earlier today, the U.S. dollar moved higher against the euro after ECB member Benoit Coeure said that the bank is considering a negative deposit rate. The greenback was little changed against the Japanese yen, but declined sharply against the British pound after the Bank of England upgraded its forward guidance on rates. What happened with other major currency pairs? If you want to know our take on this question, we invite you to read our today's Forex Trading Alert.
In our opinion the following forex trading positions are justified - summary:
EUR/USD
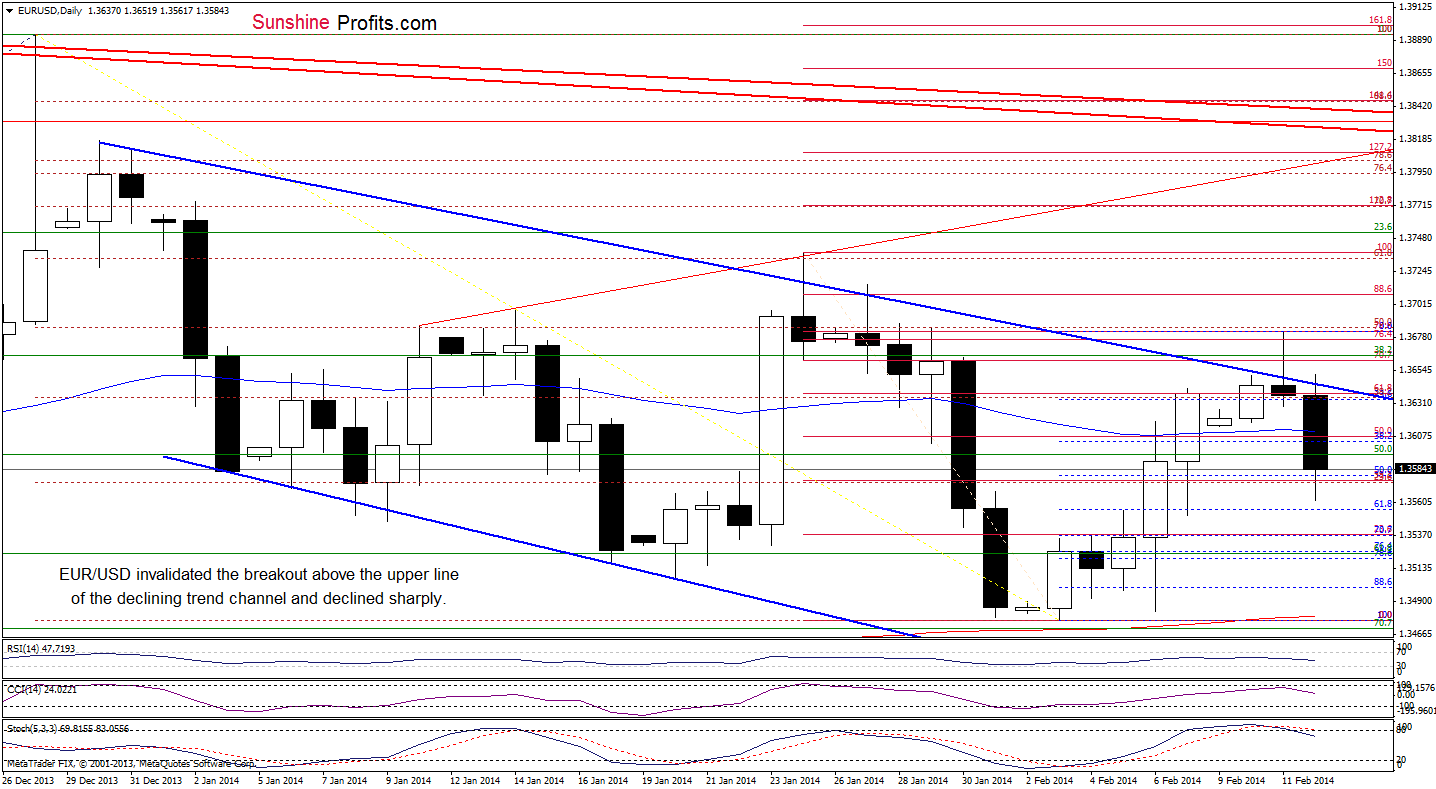
Yesterday, EUR/USD declined below the upper line of the declining trend channel and invalidated a breakout above this important support line. An invalidation of the breakout was a strong bearish signal, which triggered further declines earlier today. As you see on the above chart, with this downswing the pair dropped not only below the 50-day moving average, but also below the 50%Fibonacci retracement level (based on the recent rally). Although EUR/USD rebounded in the following hours, it still remains below the upper line of the declining trend channel, which serves as major resistance at the moment. Taking this fact into account and combining with sell signals generated by the CCI and Stochastic Oscillator, it seems that we may see another attempt to move lower in the nearest future.
Very short-term outlook: bearish
Short-term outlook: mixed
MT outlook: mixed
LT outlook: bearish
Trading position (short-term): In our opinion no positions are justified from the risk/reward perspective. We will keep you informed should anything change, or should we see a confirmation/invalidation of the above.
GBP/USD
Quoting our last Forex Trading Alert:
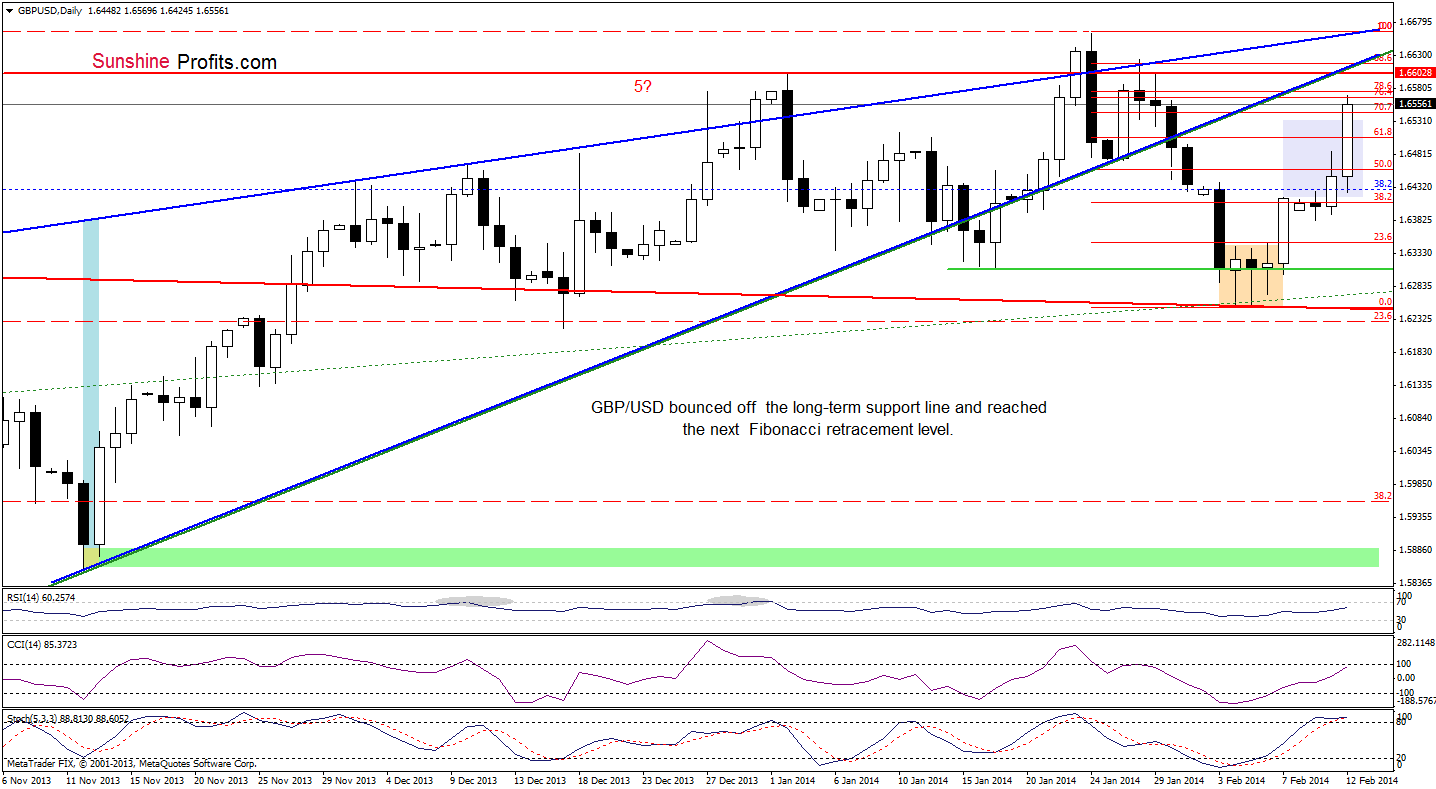
(…) GBP/USD broke above the upper line of a consolidation range, which suggests that if the buyers do not give up, we may see an upswing to at least the 61.8% Fibonacci retracement level (the price target for this pattern is around 1.6531).
As you see on the above chart, the buyers not only realized their pro growth scenario, but also managed to push the pair to a resistance zone created by the 76.4% and 78.6% Fibonacci retracement levels (based on the recent decline). If it is broken, we will likely see further improvement and the upside target will be the previously-broken lower border of the rising wedge. Looking at the position of the indicators, we see that they still support the bullish case. However, the space for further growth seems limited.
Very short-term outlook: bullish
Short-term outlook: mixed with bullish bias
MT outlook: mixed
LT outlook: mixed
Trading position (short-term): In our opinion no positions are justified from the risk/reward perspective. We will keep you informed should anything change, or should we see a confirmation/invalidation of the above.
USD/JPY
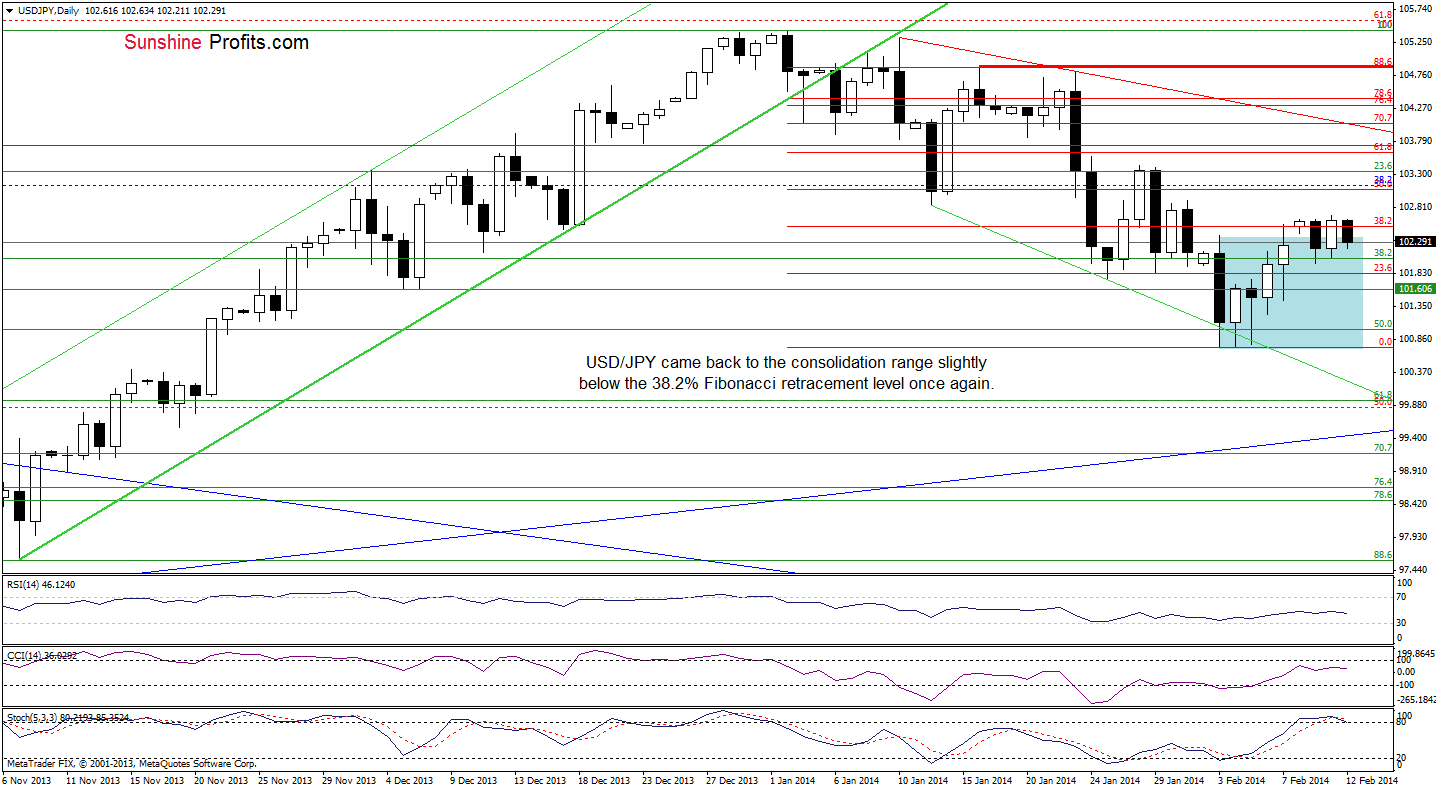
On the above chart, we see that the situation hasn’t changed much as USD/JPY remains in a narrow range slightly below the 38.2% Fibonacci retracement level based on the recent decline. When we take a closer look at the position of the Stochastic Oscillator, we see that the indicator is still overbought and very close to generating a sell signal. Therefore, what we wrote in our last Forex Trading Alert remains up-to-date.
(…) if these circumstances encourage the sellers to act, we may see another attempt to move lower. If this is the case, the first downside target will be around 101.43 where Friday low is. On the other hand, if the buyers do not give up and push the exchange rate higher, we may see an upswing to the next Fibonacci retracement level (around 103.08).
Very short-term outlook: mixed
Short-term outlook: mixed with bearish bias
MT outlook: bullish
LT outlook: bearish
Trading position (short-term): In our opinion no positions are justified from the risk/reward perspective. We will keep you informed should anything change, or should we see a confirmation/invalidation of the above.
USD/CAD
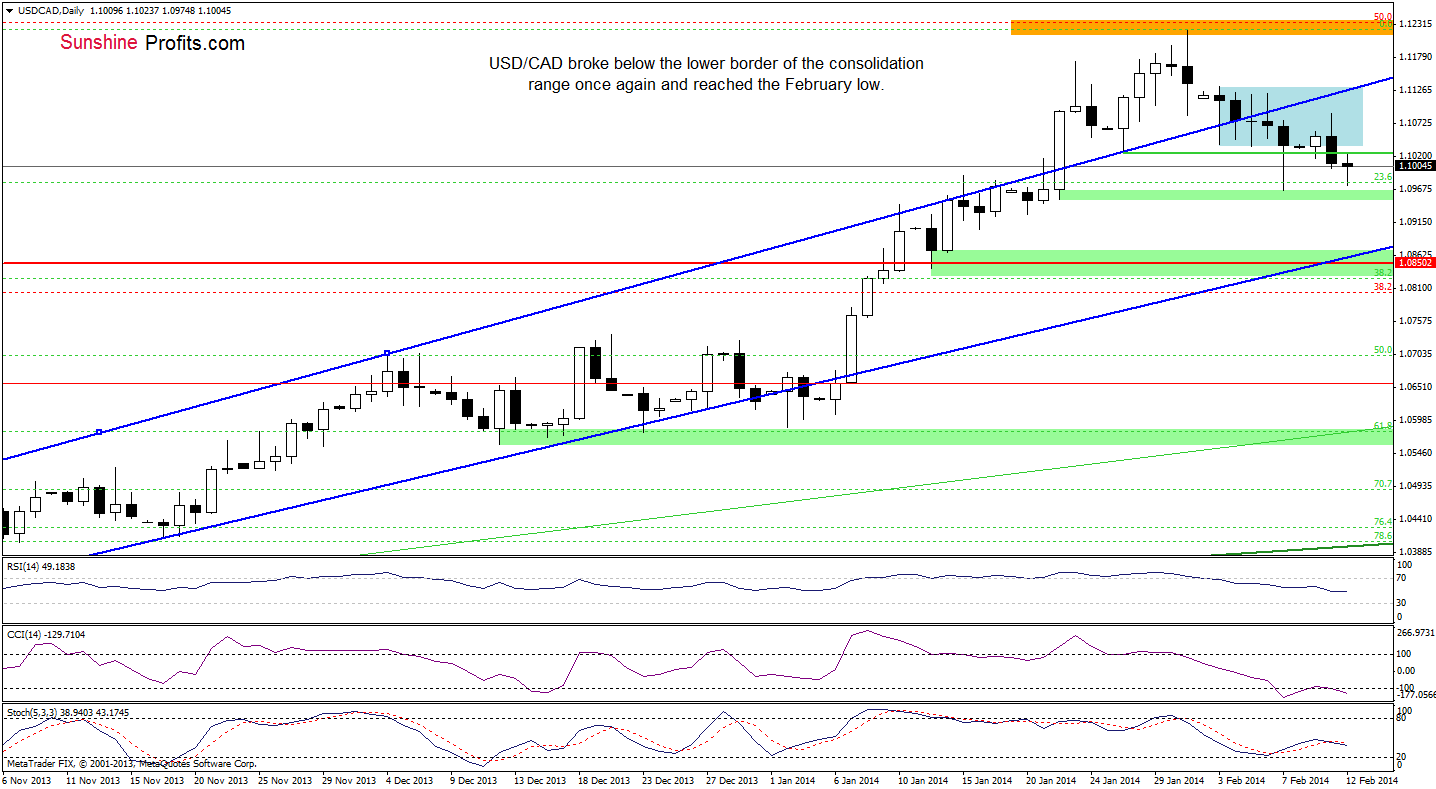
Looking at the above chart, we see that the situation has deteriorates as USD/CAD dropped below the lower border of a consolidation range once again. With this downswing, the pair declined and almost touched the February low. At this point, we should consider two scenarios. If this support level encourages buyers to act, we will likely see another comeback to the consolidation range. However, if it is broken and the exchange rate closes the day below the Jan.22 low, it will likely trigger a decline to 1.0904 (the Jan. 16 low) or even to a strong support zone created by the 38.2% Fibonacci retracement level (based on the entire Sept.-Jan. rally), the lower border of the trend channel, the Jan. 13 low and the 2010 high.
Very short-term outlook: mixed
Short-term outlook: mixed
MT outlook: bullish
LT outlook: bearish
Trading position (short-term): In our opinion no positions are justified from the risk/reward perspective. We will keep you informed should anything change, or should we see a confirmation/invalidation of the above.
USD/CHF
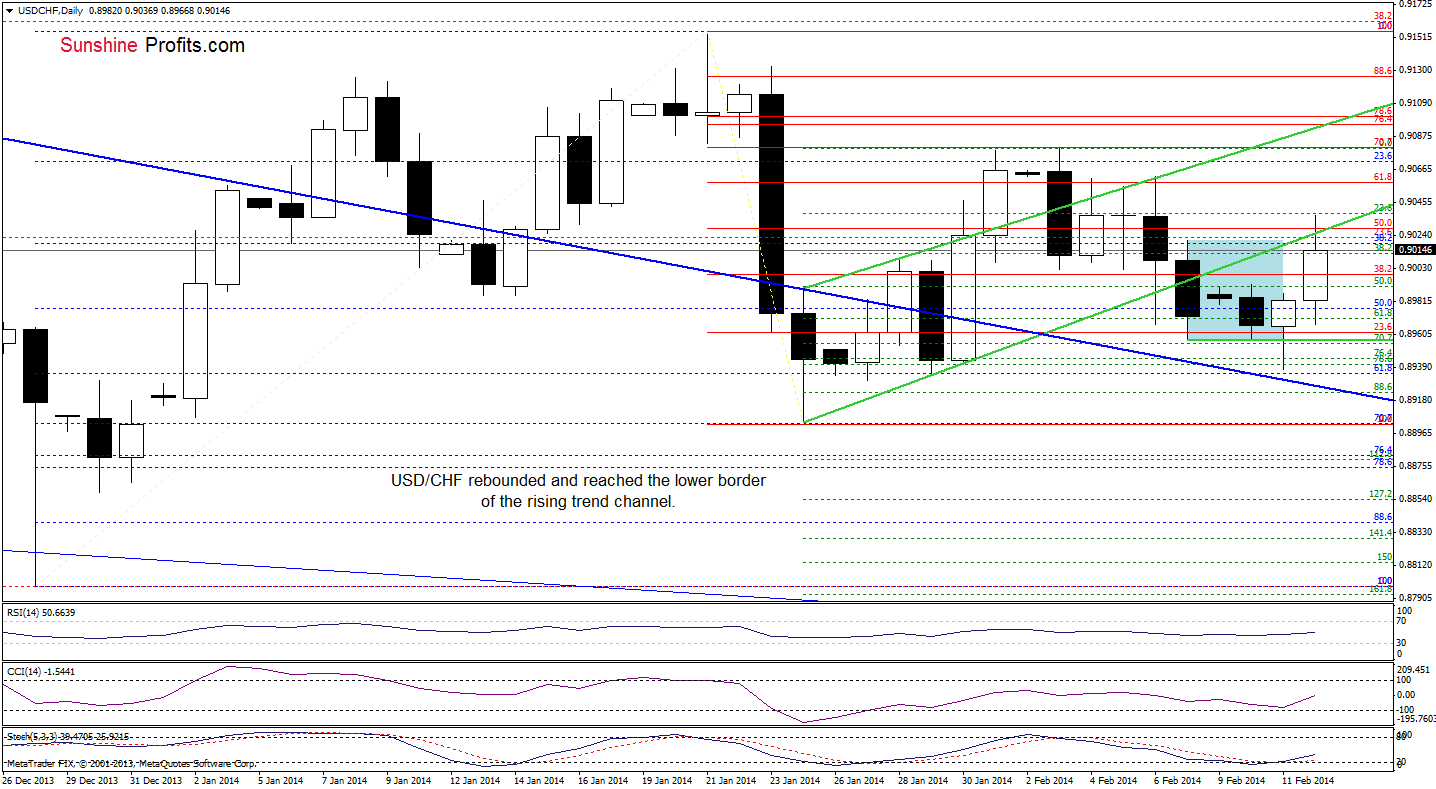
Quoting our last Forex Trading Alert:
(…) the exchange rate (…) almost touched the short-term declining support line (marked with blue) (…) the proximity to this strong support encouraged buyers to act and resulted in an upswing that took the pair to a consolidation range (marked with blue). This is a positive signal – especially when we factor in the position of the CCI and Stochastic Oscillator (…) both indicators are oversold, which suggests that a pause or corrective upswing is just around the corner.
As you see on the above chart, we noticed such price action earlier today. USD/CHF extended gains and broke above the lower border of the rising trend channel. However, this improvement was only temporary and the exchange rate dropped below this strong resistance line once again. Nevertheless, the CCI and Stochastic Oscillator generated buy signals, which supports the bullish case. Taking this fact into account, it seems that another attempt to move higher can’t be ruled out.
Very short-term outlook: mixed with bullish bias
Short-term outlook: mixed
MT outlook: bearish
LT outlook: bearish
Trading position (short-term): In our opinion no positions are justified from the risk/reward perspective. We will keep you informed should anything change, or should we see a confirmation/invalidation of the above.
AUD/USD
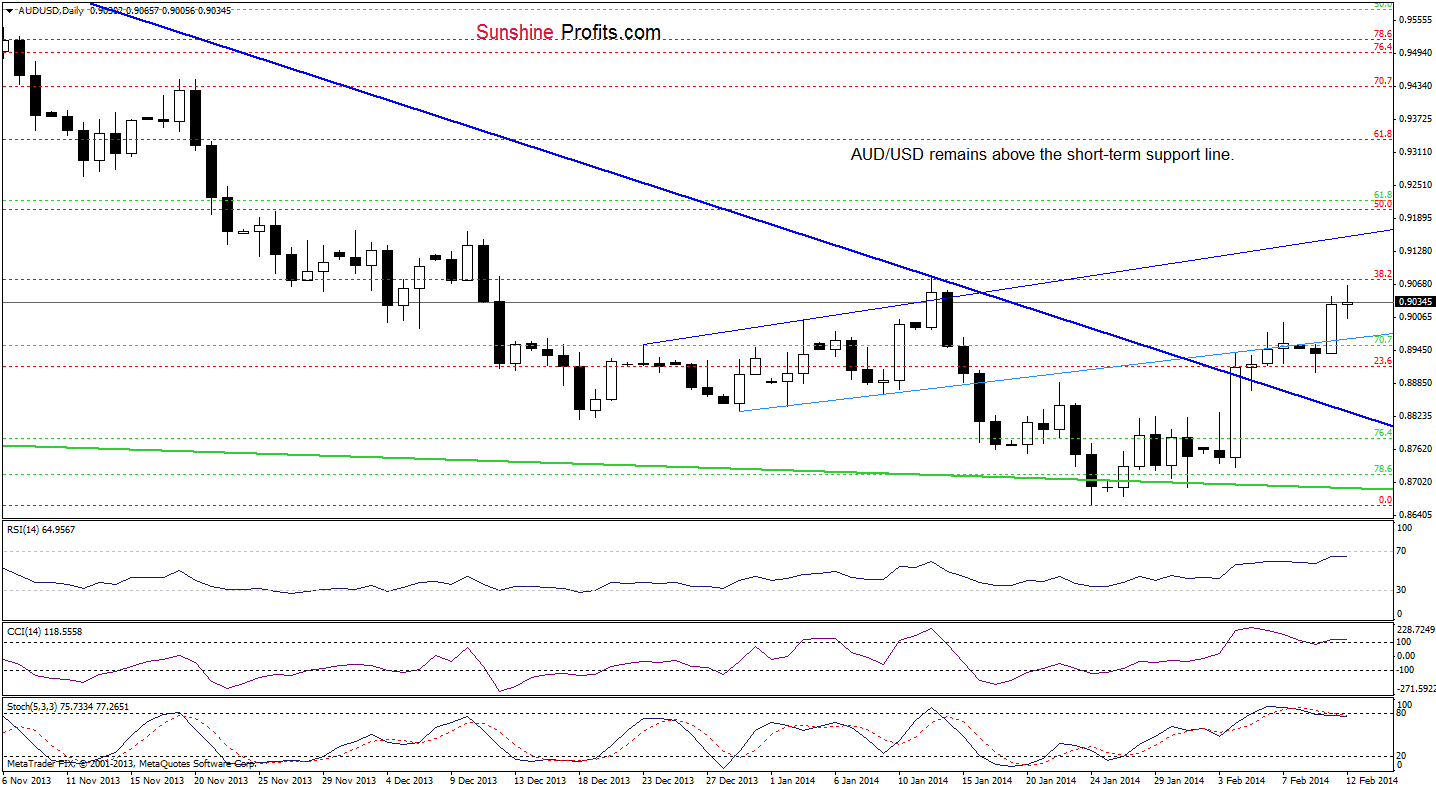
On the above chart, we see that AUD/USD moved higher once again and approached the 38.2% Fibonacci retracement level based on the entire Oct.-Jan. decline. Taking into account the proximity to this resistance level and combining it with the current position of the indicators (the CCI is overbought, a sell signal generated by the Stochastic Oscillator remains in place and the RSI is at its highest level since October), it seems that a correction is just around the corner and we think that taking the profits off the table yesterday was a good idea. Nevertheless, as long as the exchange rate remains above the short-term blue rising line, the space for declines seems limited.
Very short-term outlook: bullish
Short-term outlook: mixed with bullish bias
MT outlook: bearish
LT outlook: bearish
Trading position (short-term): In our opinion no positions are justified from the risk/reward perspective. We will keep you informed should anything change, or should we see a confirmation/invalidation of the above.
Thank you.
Nadia Simmons
Forex & Oil Trading Strategist
Forex Trading Alerts
Oil Investment Updates
Oil Trading Alerts

