
Earlier today, the British pound remained steady against the dollar as the Bank of England left interest rates at record lows of 0.5%. Meanwhile, the euro declined against the U.S. currency despite the European Central Bank decided to leave its interest rates on hold (at their record low of 0.25%). However, it reversed after a disappointing U.S. trade balance reading. The greenback was little changed against the Japanese yen, but declined sharply against the Swiss franc. What happened with the AUD/USD pair? The Aussie climbed to three-and-a-half week high against its U.S. counterpart boosted by an unexpected trade surplus in December and better-than-expected retail sales. Additionally, the National Australia Bank said that its business confidence index rose to 8 in the fourth quarter from a reading of 5 in the third quarter. What is the outlook for major currency pairs? We invite you to read our today's Forex Trading Alert.
In our opinion the following forex trading positions are justified - summary:
- EUR/USD: none
- GBP/USD: none
- USD/JPY: none
- USD/CAD: none
- USD/CHF: none
- AUD/USD: long (stop-loss order: 0.8728 and an upside target: 0.9069)
EUR/USD
In our last Forex Trading Alert, we wrote:
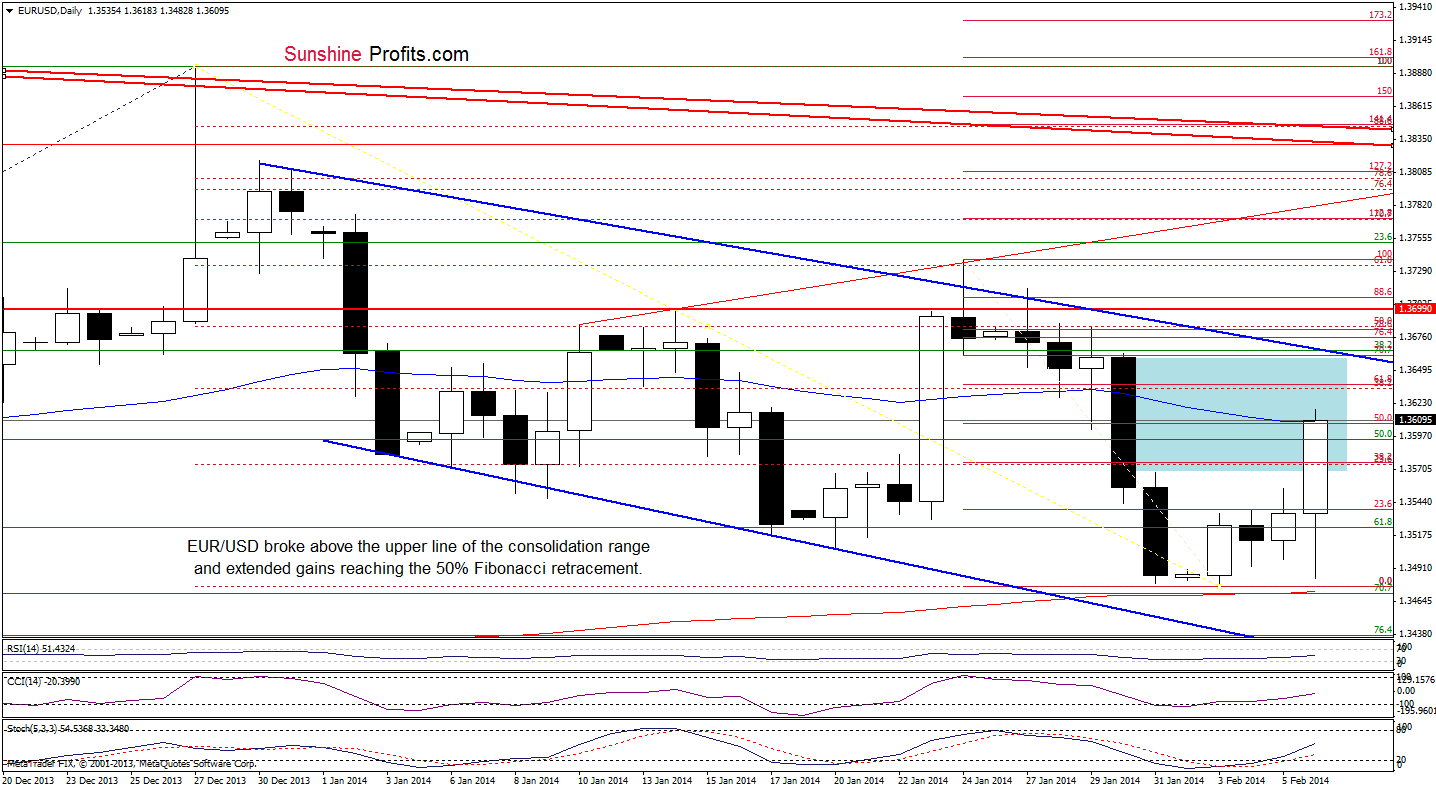
(..) the situation hasn’t changed much as EUR/USD remains in a consolidation range (marked with blue)(…) it seems that as long as the pair is trading in this area, further gains and declines seem limited. Please note that the lower border of this formation is reinforced by 70.7% Fibonacci retracement level and the 200-day moving average. Additionally, the CCI and Stochastic Oscillator generated buy signals, which will likely trigger an upward move (and a breakout above the upper line of the consolidation range) in the coming day (or days).
Looking at the above chart, we see that the situation has improved as EUR/USD broke above the upper border of the consolidation range, the 50% Fibonacci retracement level and the 50-day moving average. Taking these facts into account and combining with the size of today’s rally and buy signals generated by the indicators, we will likely see further improvement. According to theory, the upside target for this pattern will be around 1.3660 (slightly below the upper line of the declining trend channel and the 70.7% Fibonacci retracement level based on the recent decline).
Very short-term outlook: bullish
Short-term outlook: mixed with bullish bias
MT outlook: mixed
LT outlook: bearish
Trading position (short-term): it seems that the EUR/USD pair will move higher, up to the declining blue resistance line, but this move seems too small for us to open a long position (however, it is something that day-traders might want to consider taking advantage of). We plan to position ourselves according to the trend channel (blue lines) - probably by opening a long position after the rally stops and confirms that it's once again about to decline more significantly. We will keep you informed should anything change, or should we see a confirmation/invalidation of the above.
GBP/USD
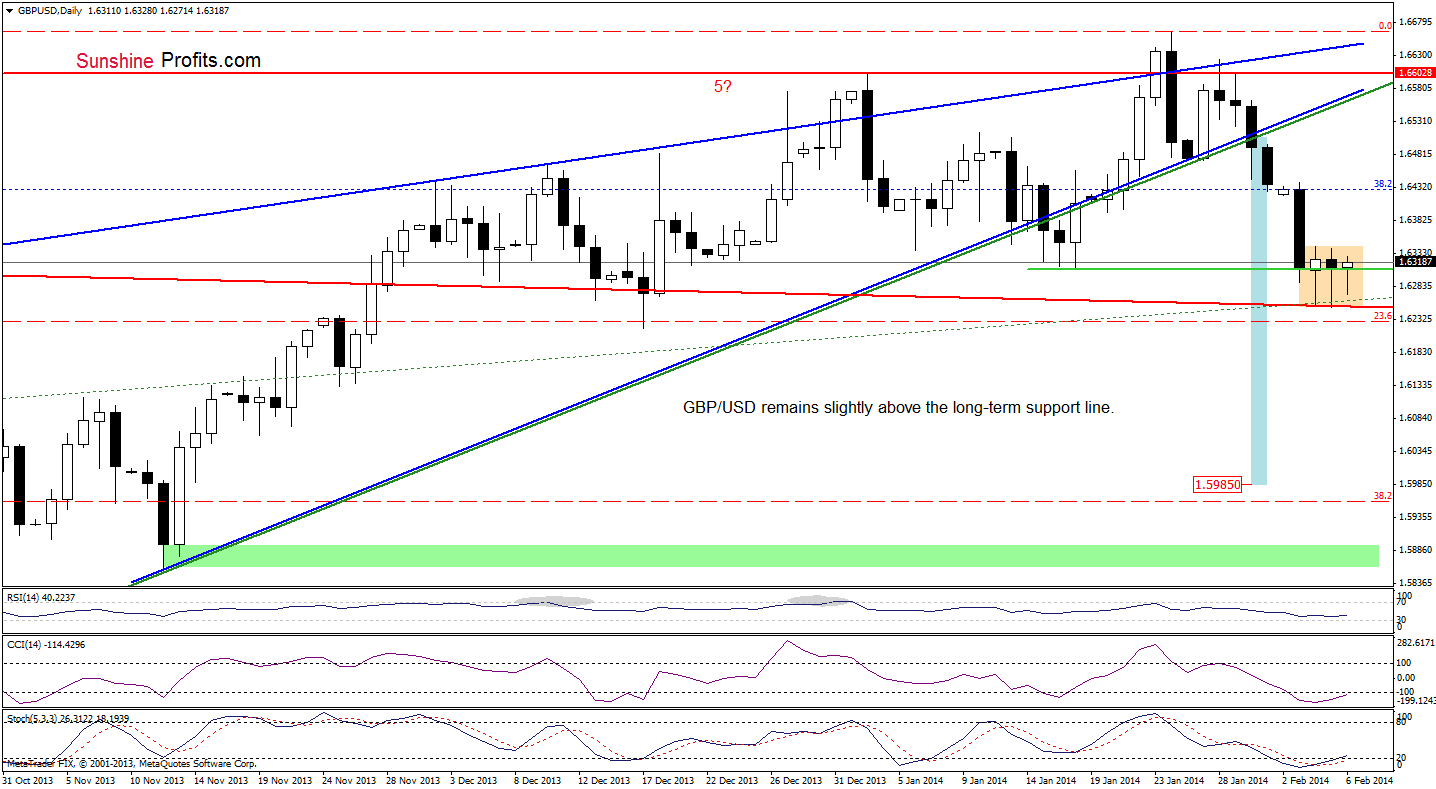
As you see on the above chart, the situation hasn’t changed much as GBP/USD remains in a consolidation. Despite a drop that we saw earlier today, the pair still remains above the long-term declining support line (marked with red), which successfully stopped further deterioration in December and also earlier this week. Taking this fact into account, what we wrote in our previous Forex Trading Alert remains up-to-date.
(…) if this strong support line encourages the buyers to push the order button, we will likely see a corrective upswing (…). However, if it is broken, we will see further deterioration and the next target for the sellers will be around 1.5985 where the price target for the breakdown below the lower border of the rising wedge is. Such price action might make us consider opening short positions.
Please note that the indicators are oversold (additionally, the Stochastic Oscillator generated a buy signal), which suggest that the space for further declines may be limited and we may see a see a corrective upswing in the near future.
Very short-term outlook: bearish
Short-term outlook: mixed with bearish bias
MT outlook: mixed
LT outlook: mixed
Trading position (short-term): In our opinion no positions are justified from the risk/reward perspective. We will keep you informed should anything change, or should we see a confirmation/invalidation of the above.
USD/JPY
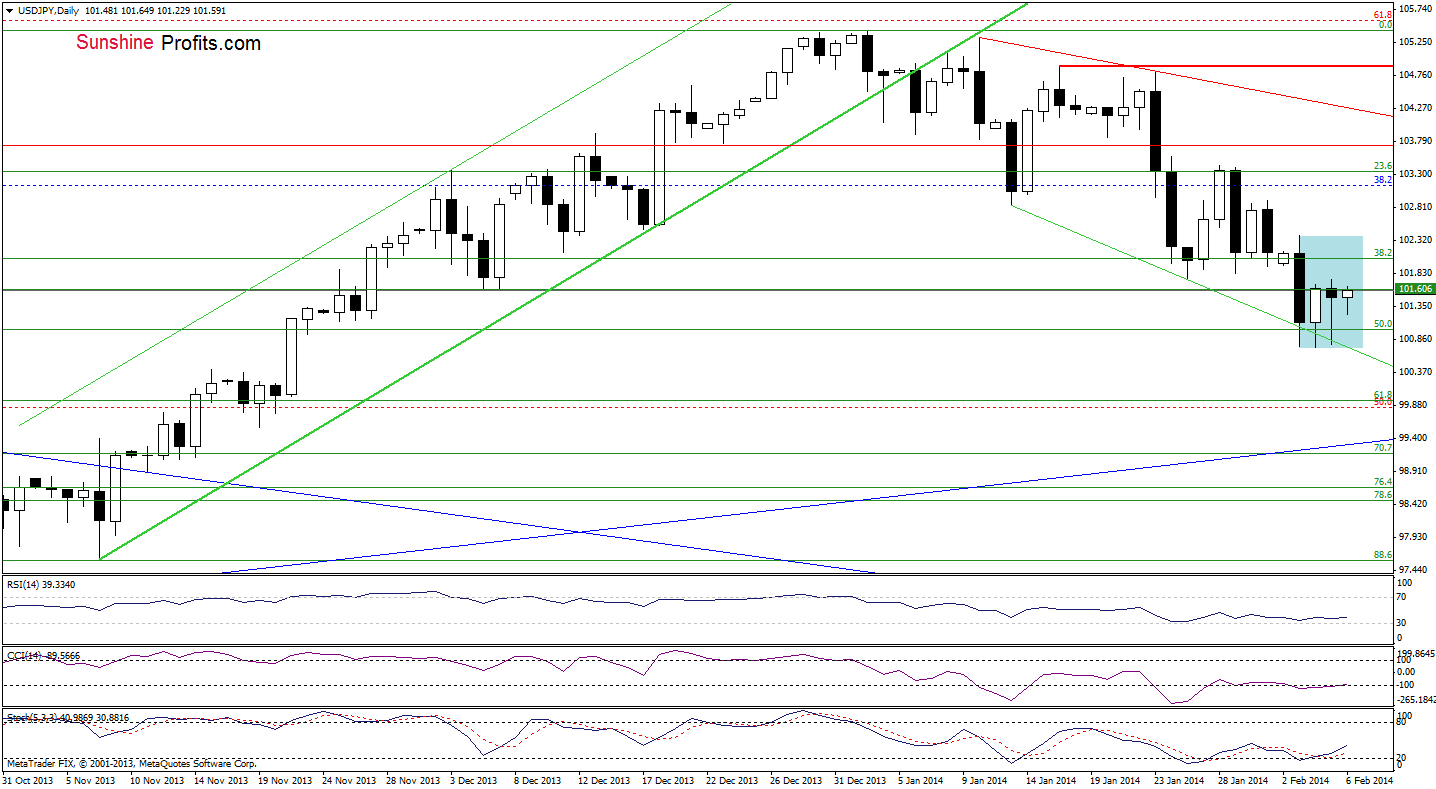
Looking at the above chart, we see that the situation hasn’t changed much as USD/JPY remains in a consolidation range (marked with blue) slightly above declined the support zone created by the 50% Fibonacci retracement level and the very short-term declining support line (marked with green). From this perspective, what we wrote in our last Forex Trading Alert remains up-to-date.
(…) it seems that a breakout above the upper line (or breakdown below the lower line) will trigger a bigger upward (or downward) move. (…) the CCI and Stochastic Oscillator are very close to generating buy signals, which is a positive sign. Nevertheless, we should keep in mind that the pair remains below the previous lows and the size of an upward correction is still quite small. Therefore, it seems justified to wait for further improvement before consider opening long positions.
Very short-term outlook: bearish
Short-term outlook: mixed with bearish bias
MT outlook: bullish
LT outlook: bearish
Trading position (short-term): In our opinion no positions are justified from the risk/reward perspective. We will keep you informed should anything change, or should we see a confirmation/invalidation of the above.
USD/CAD
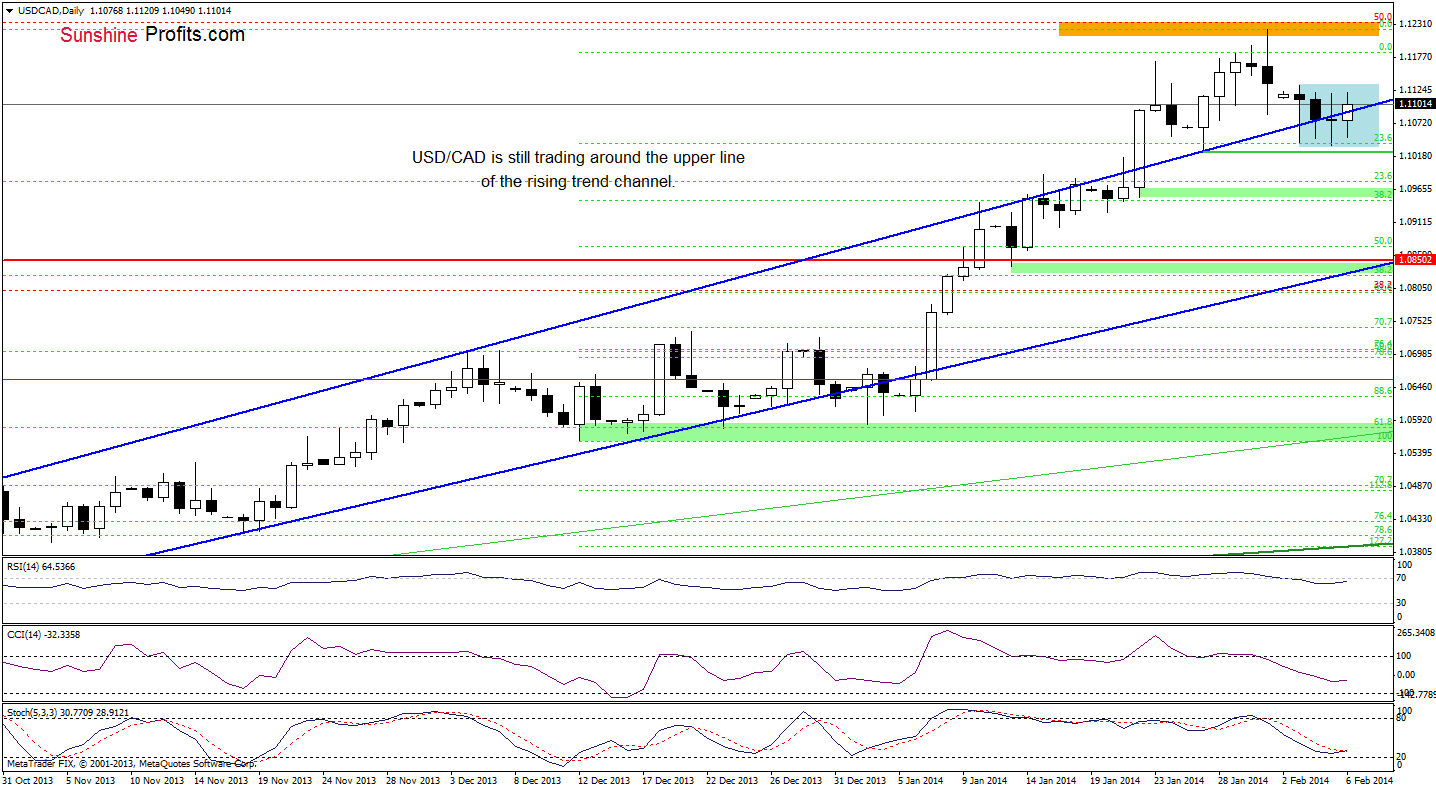
On the above chart, we see that the situation hasn’t changed much despite the fact that USD/CAD closed the day slightly below the upper line of the rising trend channel. Despite this deterioration, the pair rebounded and is still trading in a consolidation range (marked with blue). On one hand, taking into account the current position of the indicators, if the buyers managed to push the exchange rate above the upper line of the consolidation range, we may see an upswing to the January high. On the other hand, if the exchange rate declines below the lower border of the consolidation once again and also below the Jan.27 low, we may see further deterioration and the first downside target for the sellers would be around 1.0952 where the Jan.22 low is. However, if it is broken, we will likely see a drop to 1.0904 (the Jan. 16 low) or even to a strong support zone created by the 38.2% Fibonacci retracement level (based on the entire Sept.-Jan. rally), the lower border of the trend channel, the Jan. 13 low and the 2010 high.
Very short-term outlook: mixed
Short-term outlook: bullish
MT outlook: bullish
LT outlook: bearish
Trading position (short-term): In our opinion, if the pair closes the day below the upper line of the rising trend channel and declines below the Jan. 27 low at 1.1030, we might consider going short. We will keep you informed should anything change, or should we see a confirmation/invalidation of the above.
USD/CHF
Quoting our last Forex Trading Alert:
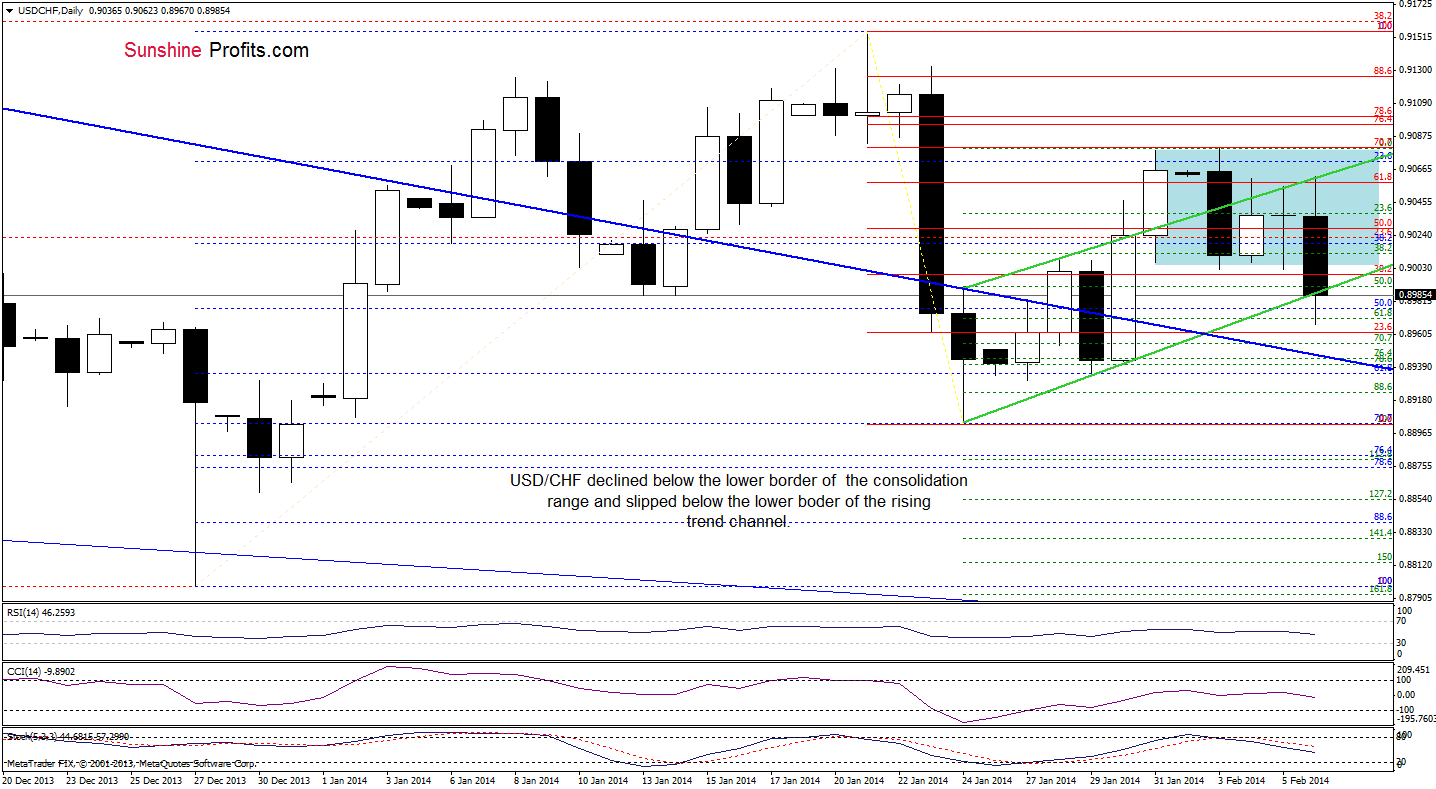
(…) an invalidation of the breakout above this support/resistance line is a bearish signal – especially when we factor in the position of the Stochastic Oscillator, which generated a sell signal (…) it seems that further deterioration is just around the corner, and the downside target for the sellers would be the lower border of the trend channel.
As you see on the above chart, the situation has deteriorated as USD/CHF broke below the lower border of the consolidation range (marked with blue) and slipped temporarily below the lower line of the trend channel. With this downswing, the pair reached the 61.8% Fibonacci retracement level (based on the recent rally), which encouraged buyers to act and resulted in a comeback to the trend channel. Nevertheless, although the exchange rate reversed, it still remains below the resistance line created by the lower border of the consolidation range. Taking this fact into account, and combining with the position of the indicators, it seems that another attempt to move below the lower line of the trend channel is likely to be seen.
Very short-term outlook: mixed with bearish bias
Short-term outlook: mixed
MT outlook: bearish
LT outlook: bearish
Trading position (short-term): In our opinion no positions are justified from the risk/reward perspective. We will keep you informed should anything change, or should we see a confirmation/invalidation of the above.
AUD/USD
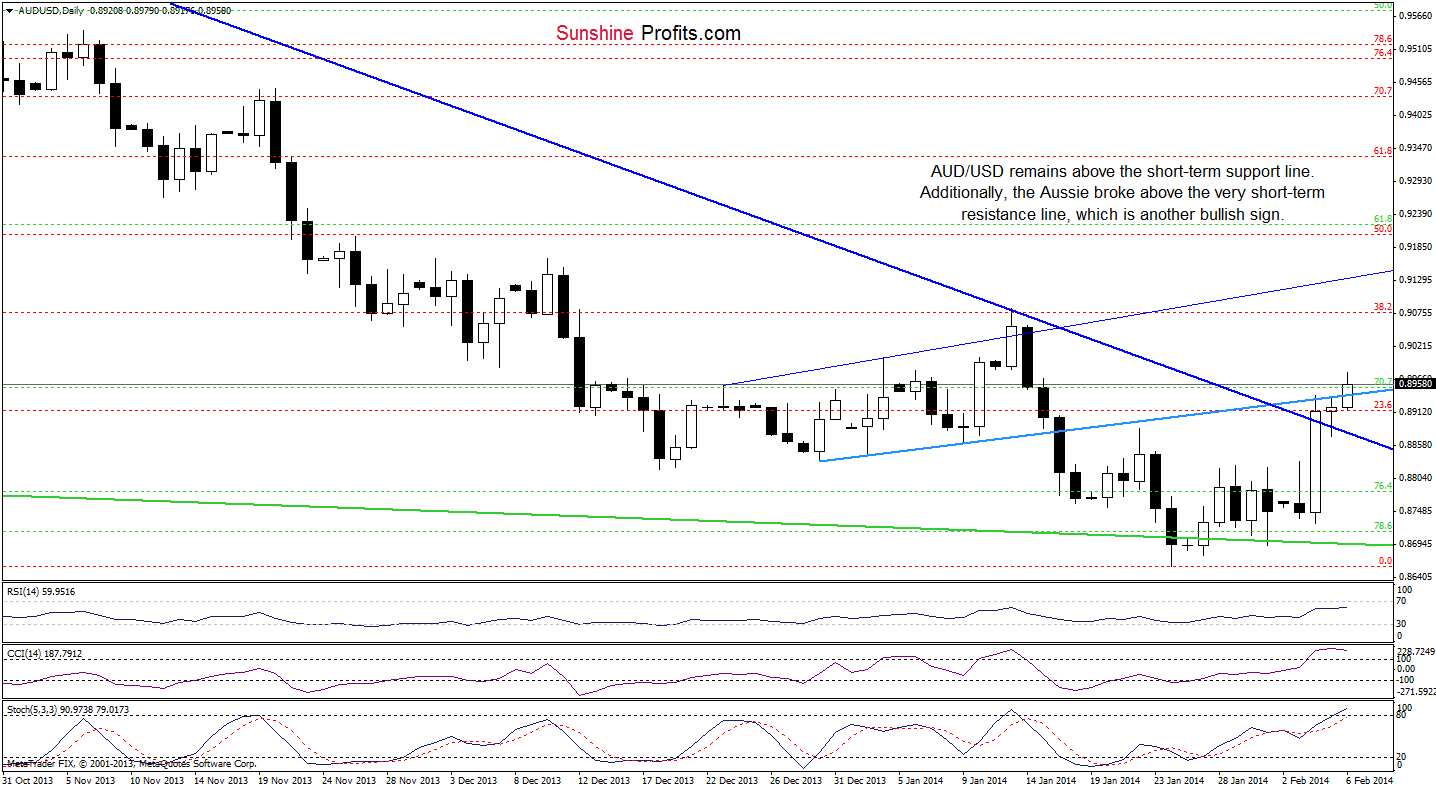
As you see on the above chart, the situation has improved as AUD/USD broke above the very short-term blue rising resistance line. Taking this fact into account, we will likely see further improvement and the next upside target will be the 38.2% Fibonacci retracement level, which corresponds to the Jan. 13 high. Looking at the position of the indicators, we see that they still support the bullish case.
Very short-term outlook: bullish
Short-term outlook: mixed with bullish bias
MT outlook: bearish
LT outlook: bearish
Trading position (short-term): long (stop-loss order: 0.8728 and an upside target: 0.9069). We will keep you informed should anything change as far as our opinion is concerned, or should we see a confirmation/invalidation of the above. The above is not an investment / trading advice and please note that trading (especially using leveraged instruments such as futures or on the Forex market) involves risk.
Thank you.
Nadia Simmons
Forex & Oil Trading Strategist
Forex Trading Alerts
Oil Investment Updates
Oil Trading Alerts

