
Earlier today, the U.S. currency moved lower against the euro after data showed that the euro zone's private sector posted its strongest growth in more than two-and-a half years in January. The greenback also declined against the yen and its Canadian counterpart. Meanwhile, the U.S. dollar increased against the British pound after data showed that the U.K. services PMI for January dropped to a seven-month low of 58.3. The U.S. currency also improved against the Swiss franc and the Australian dollar. Did these moves change the outlook for major currency pairs? We invite you to read our today's Forex Trading Alert.
In our opinion the following forex trading positions are justified - summary:
- EUR/USD: none
- GBP/USD: none
- USD/JPY: none
- USD/CAD: none
- USD/CHF: none
- AUD/USD: long (stop-loss order: 0.8728 and an upside target: slightly below 0.9075)
EUR/USD
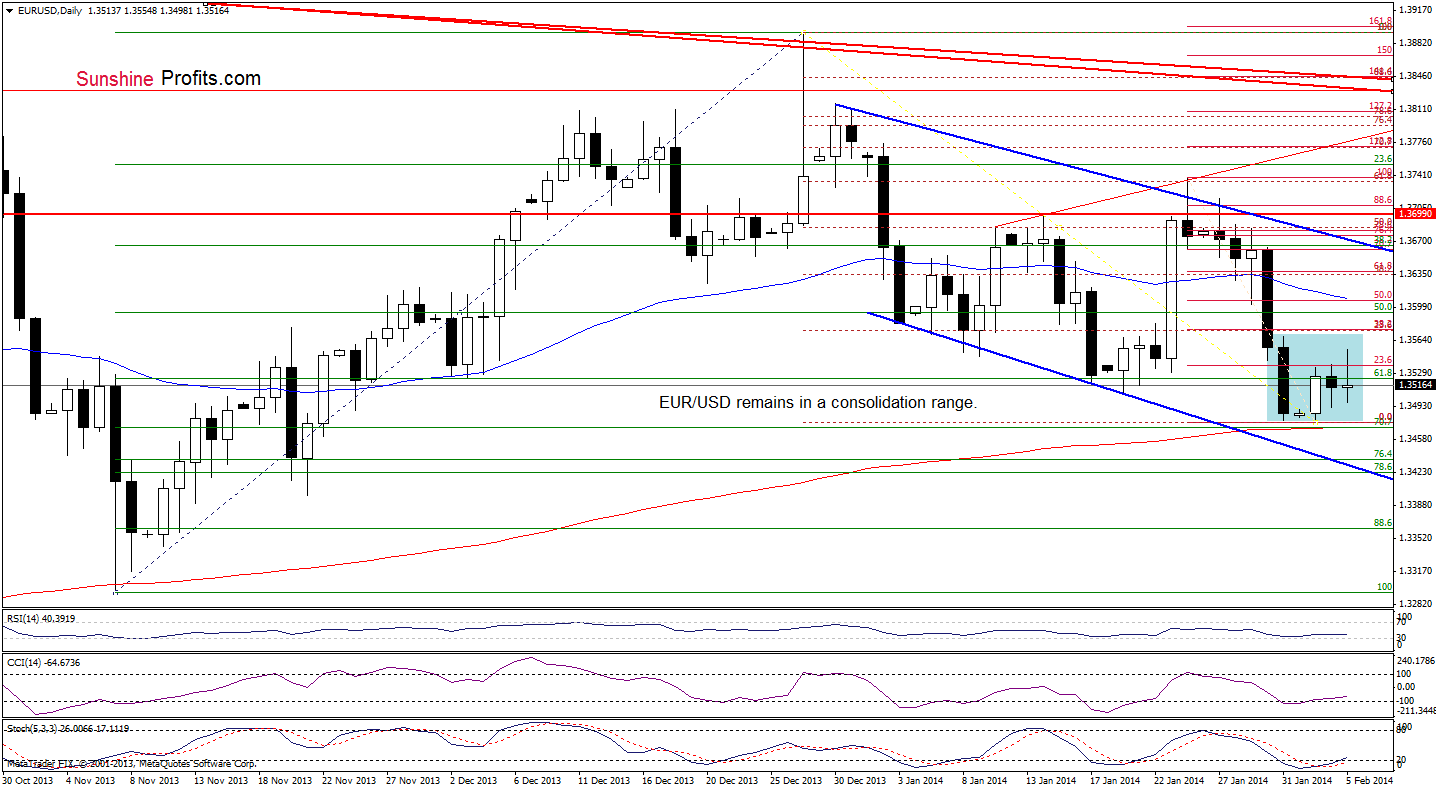
Looking at the above chart, we see that the situation hasn’t changed much as EUR/USD remains in a consolidation range (marked with blue). So, what we wrote in our last Forex Trading Alert remains up-to-date also today.
(…) it seems that as long as the pair is trading in this area, further gains and declines seem limited. Please note that the lower border of this formation is reinforced by 70.7% Fibonacci retracement level and the 200-day moving average. Additionally, the CCI and Stochastic Oscillator generated buy signals, which will likely trigger an upward move (and a breakout above the upper line of the consolidation range) in the coming day (or days).
Very short-term outlook: mixed with bullish bias
Short-term outlook: mixed
MT outlook: mixed
LT outlook: bearish
Trading position (short-term): In our opinion no positions are justified from the risk/reward perspective. We will keep you informed should anything change, or should we see a confirmation/invalidation of the above.
GBP/USD
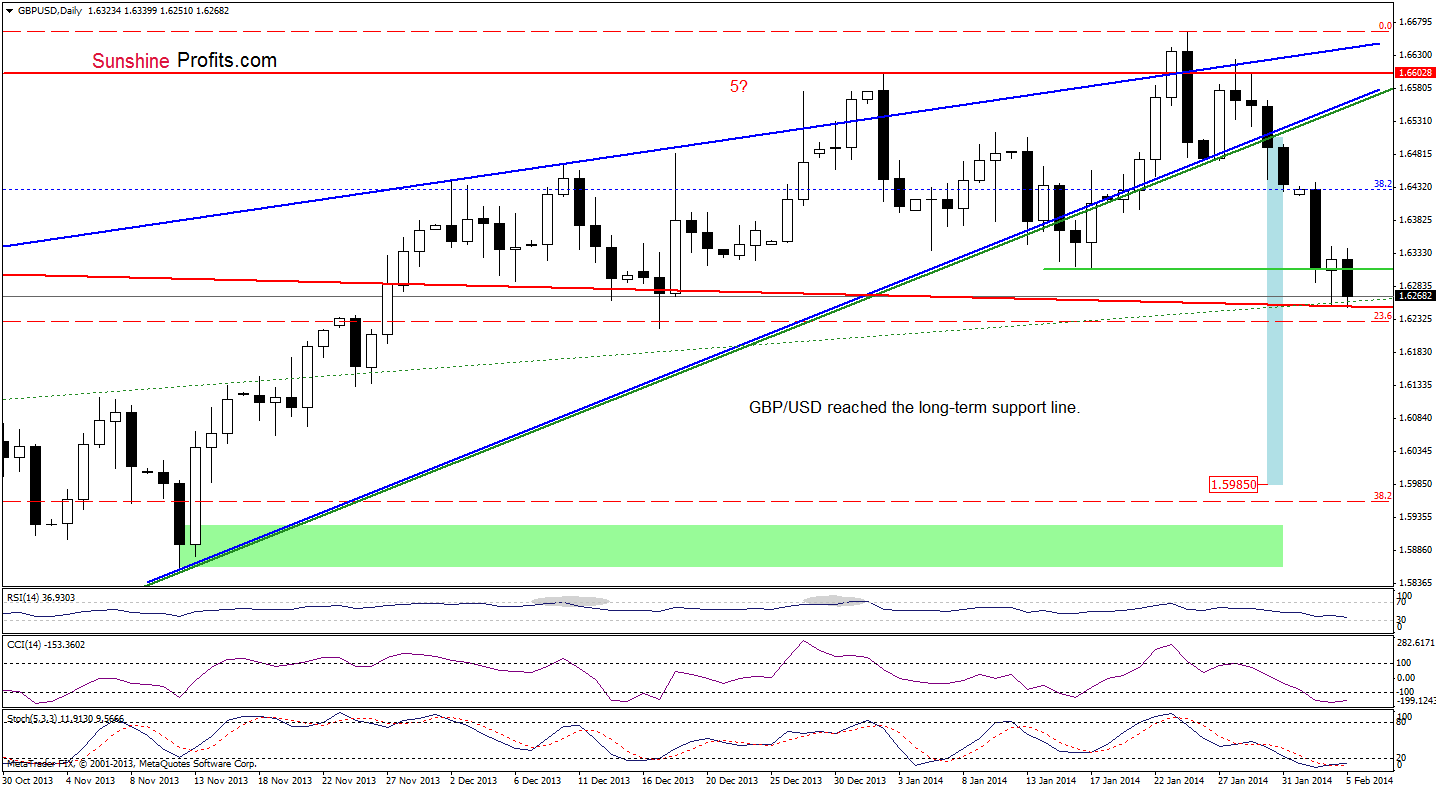
As you see on the above chart, the situation has deteriorated slightly as GBP/USD re-tested the strength of the long-term declining support line (marked with red). Despite this drop, the pair still remains above this important support. Taking this fact into account, what we wrote in our previous Forex Trading Alert remains up-to-date.
(…) GBP/USD reached (…) the long-term declining support line (marked with red) (…)If this strong support line encourages the buyers to push the order button, we will likely see a corrective upswing and the first upside target will be yesterday’s high. However, if it is broken, we will see further deterioration and the next target for the sellers will be around 1.5985 where the price target for the breakdown below the lower border of the rising wedge is. Such price action might make us consider opening short positions. Nevertheless, taking into account the position of the indicators (which are oversold), it seems that the first scenario is more likely in the coming day (or days).
Very short-term outlook: bearish
Short-term outlook: mixed with bearish bias
MT outlook: mixed
LT outlook: mixed
Trading position (short-term): In our opinion no positions are justified from the risk/reward perspective. We will keep you informed should anything change, or should we see a confirmation/invalidation of the above.
USD/JPY
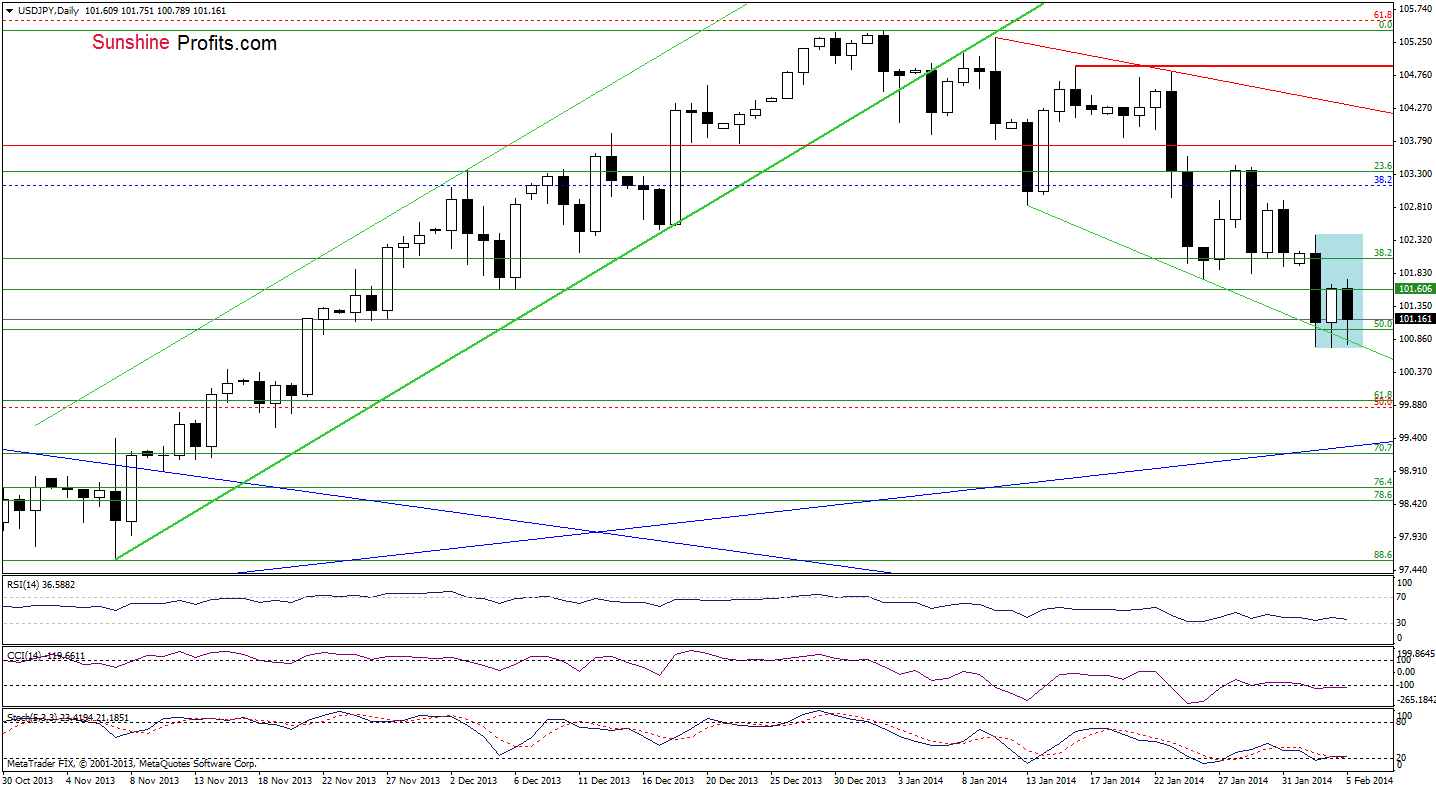
Looking at the above chart, we see that USD/JPY declined and re-tested the strength of the support zone once again. So far, the buyers managed to hold it, which is a positive sign. Nevertheless, the pair still remains in a consolidation range (marked with blue) and it seems that a breakout above the upper line (or breakdown below the lower line) will trigger a bigger upward (or downward) move.
Please note that, the CCI and Stochastic Oscillator are very close to generating buy signals, which is a positive sign. Nevertheless, we should keep in mind that the pair remains below the previous lows and the size of an upward correction is still quite small. Therefore, it seems justified to wait for further improvement before consider opening long positions.
Very short-term outlook: bearish
Short-term outlook: mixed with bearish bias
MT outlook: bullish
LT outlook: bearish
Trading position (short-term): In our opinion no positions are justified from the risk/reward perspective. We will keep you informed should anything change, or should we see a confirmation/invalidation of the above.
USD/CAD
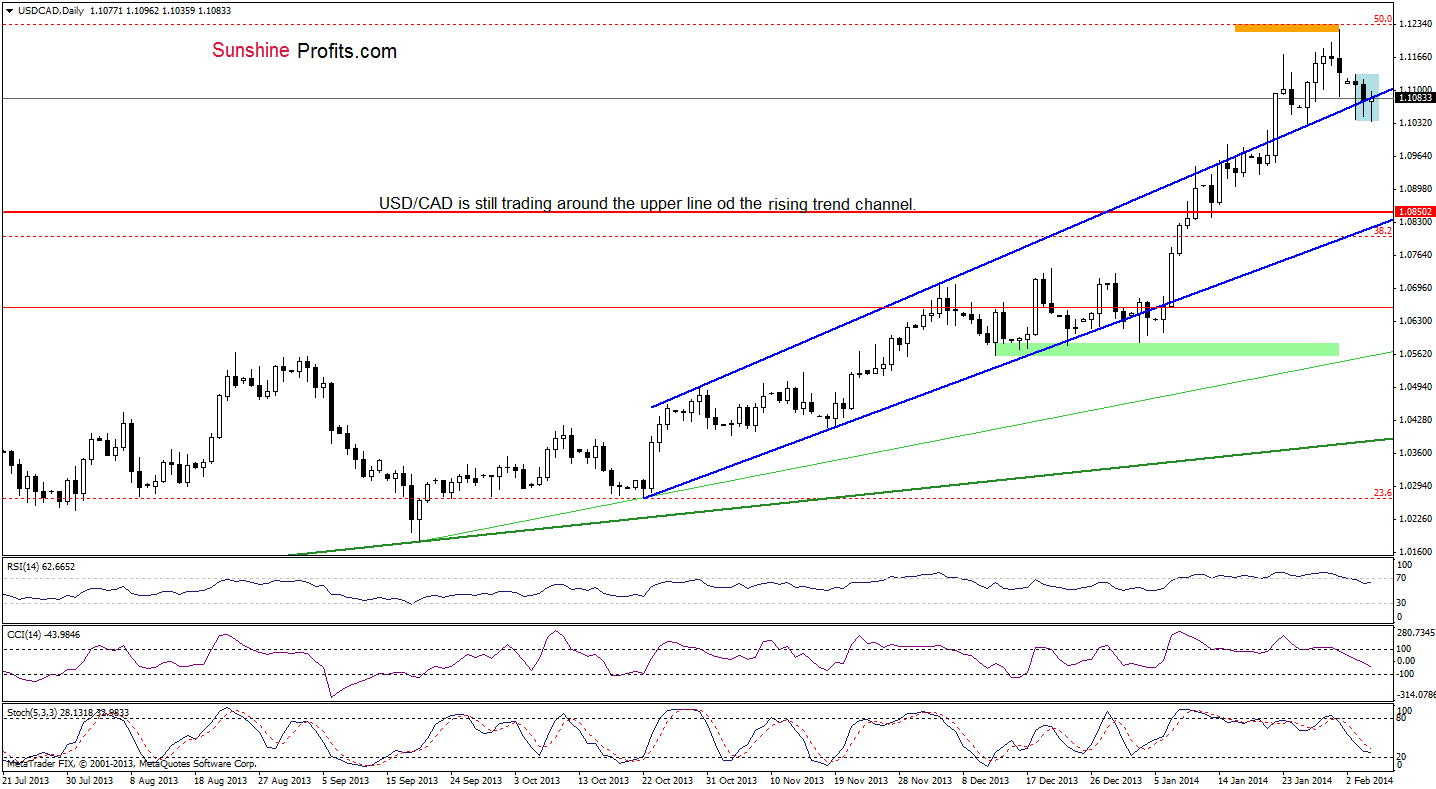
On the above chart, we see that the situation hasn’t changed much as USD/CAD is still trading in a consolidation range around the upper line of the rising trend channel.
From this perspective, what we wrote in our Forex Trading Alert on Monday remains up-to-date.
(…) the breakdown is not confirmed at the moment. It seems that if the pair closes the day below this strong support line, we will likely see further deterioration and the first downside target for the sellers will be around 1.0952 where the Jan.22 low is. On the other hand, if the buyers managed to push the exchange rate above this line once again, we may see an upswing to Friday’s high. Nevertheless, taking into account sell signals generated by the indicators it seems that the first scenario is more likely.
Very short-term outlook: mixed with bearish bias
Short-term outlook: bullish
MT outlook: bullish
LT outlook: bearish
Trading position (short-term): In our opinion, if the pair closes the day below the upper line of the rising trend channel and declines below the Jan. 27 low at 1.1030, we might consider going short. We will keep you informed should anything change, or should we see a confirmation/invalidation of the above.
USD/CHF
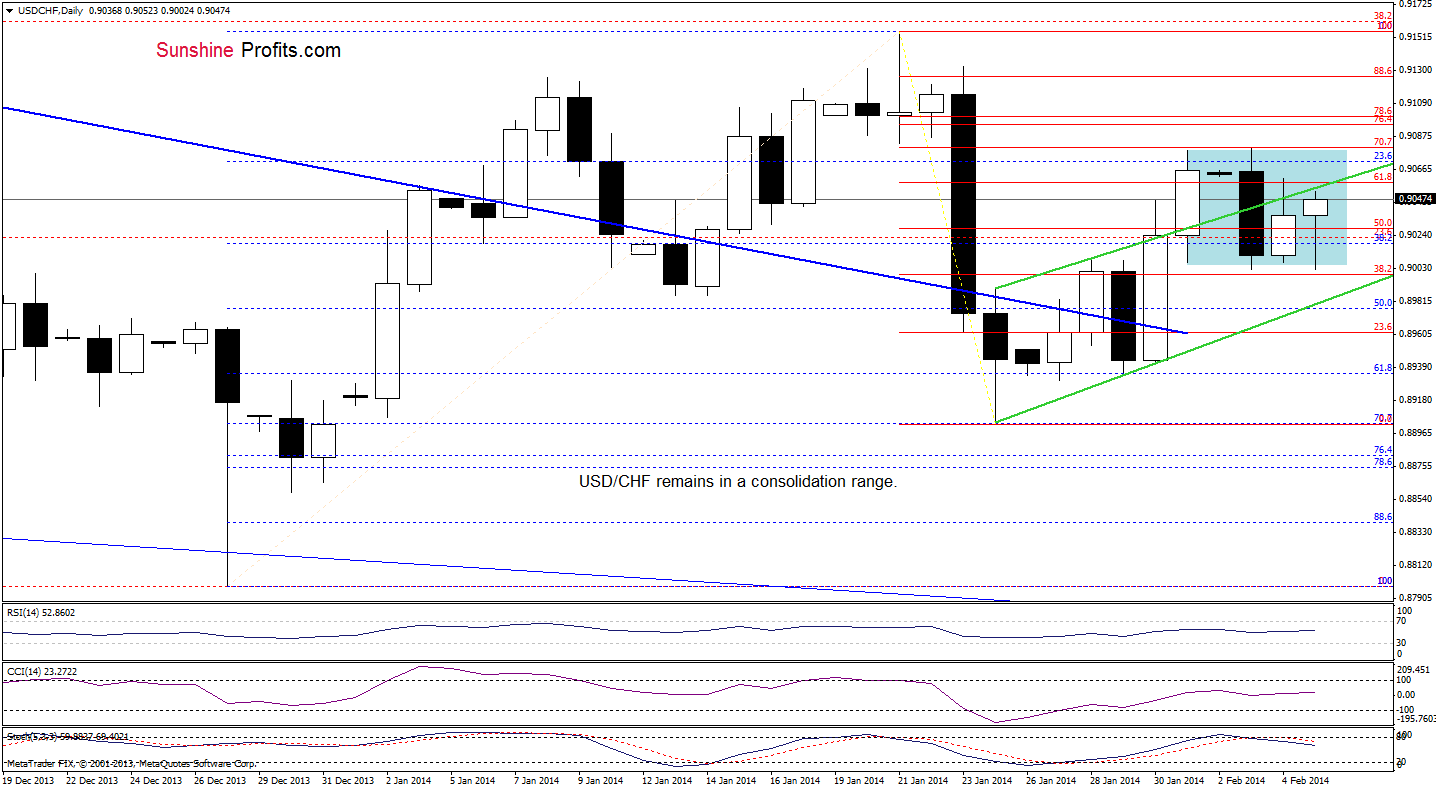
Looking at the above chart, we see that the situation hasn’t changed much as USD/CHF remains in a consolidation range (marked with blue) slightly below the upper line of the trend channel. From this perspective, what we wrote in our Forex Trading Alert on Monday is still up-to-date also today.
(…) an invalidation of the breakout above this support/resistance line is a bearish signal – especially when we factor in the position of the Stochastic Oscillator, which generated a sell signal (…) it seems that further deterioration is just around the corner, and the downside target for the sellers would be the lower border of the trend channel, which intersects with the previously-broken short-term support/resistance line (marked with dark blue) at the moment.
Very short-term outlook: mixed with bearish bias
Short-term outlook: mixed
MT outlook: bearish
LT outlook: bearish
Trading position (short-term): In our opinion no positions are justified from the risk/reward perspective. We will keep you informed should anything change, or should we see a confirmation/invalidation of the above.
AUD/USD
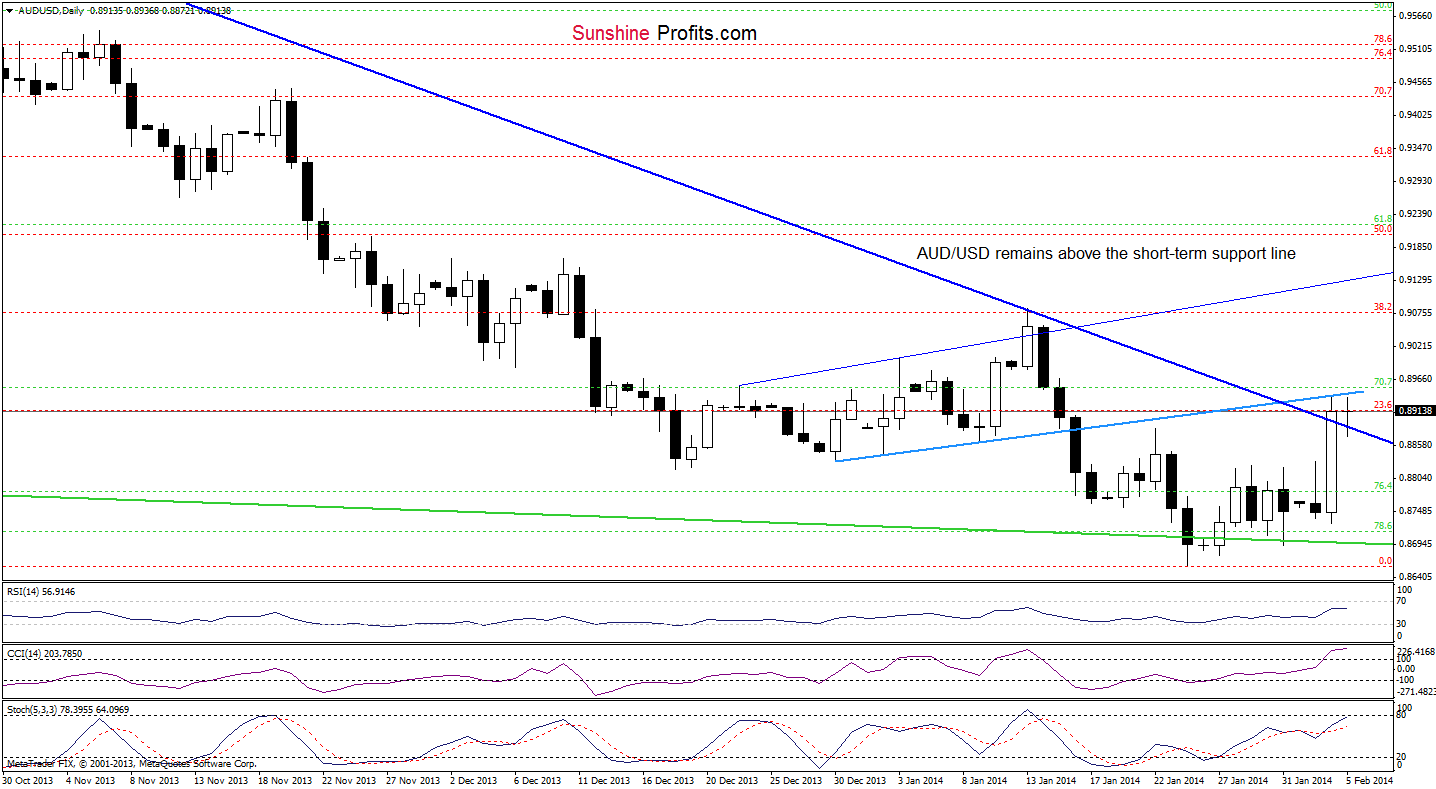
As you see on the above chart, the situation hasn’t changed much as AUD/USD remains between the previously-broken the short-term declining resistance line and the very short-term blue rising resistance line. If it is broken, we will likely see further improvement and the next upside target will be the 38.2% Fibonacci retracement level, which corresponds to the Jan. 13 high. Looking at the position of the indicators, we see that they still support the bullish case.
Very short-term outlook: bullish
Short-term outlook: mixed with bullish bias
MT outlook: bearish
LT outlook: bearish
Trading position (short-term): long ( stop-loss order: 0.8728 and an upside target: slightly below 0.9075). We will keep you informed should anything change as far as our opinion is concerned, or should we see a confirmation/invalidation of the above. The above is not an investment / trading advice and please note that trading (especially using leveraged instruments such as futures or on the Forex market) involves risk.
Thank you.
Nadia Simmons
Forex & Oil Trading Strategist
Forex Trading Alerts
Oil Investment Updates
Oil Trading Alerts

