
Earlier today, the greenback moved lower against most of major currencies after weaker-than expected U.S. economic data which showed that U.S. manufacturing PMI dropped to 53.7 in January (from December's 55.0). Additionally, the Institute for Supply Management’s manufacturing index fell to a seven-month low in January. What impact did these numbers have on major currency pairs? If you want to know our take on this question, we invite you to read our today's Forex Trading Alert.
In our opinion the following Forex Trading Positions are justified - Summary:
EUR/USD
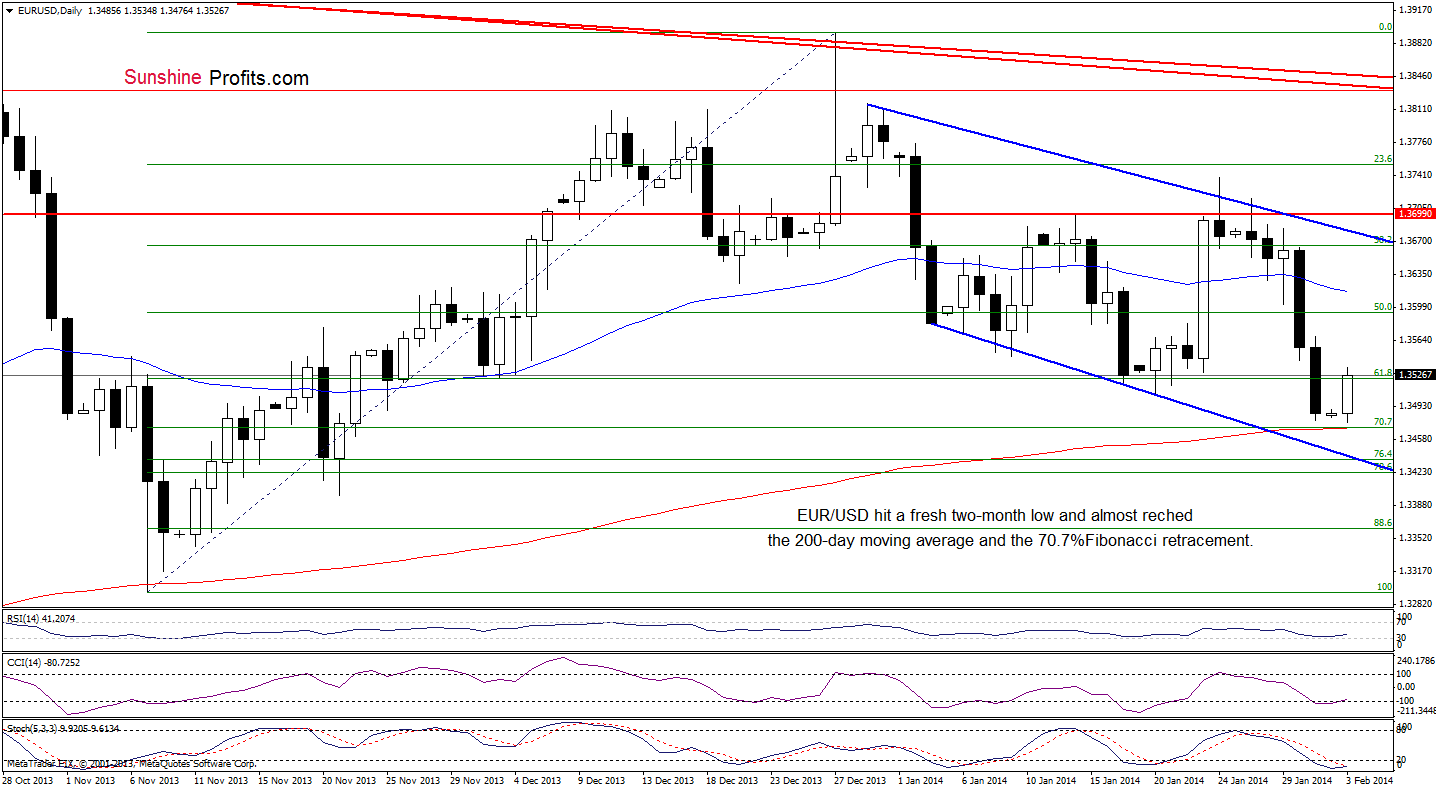
As you see on the above chart, EUR/USD extended its decline and hit a fresh two-month low. With this downswing, the pair almost reached the 70.7% Fibonacci retracement level and the 200-day moving average. If this support zone encourages the buyers, we will likely see further improvement. Please note that this scenario is reinforced by the indicators (the CCI and Stochastic Oscillator are close to generating buy signals).
Very short-term outlook: mixed with bullish bias
Short-term outlook: mixed
MT outlook: mixed
LT outlook: bearish
Trading position (short-term): In our opinion no positions are justified from the risk/reward perspective. We will keep you informed should anything change, or should we see a confirmation/invalidation of the above.
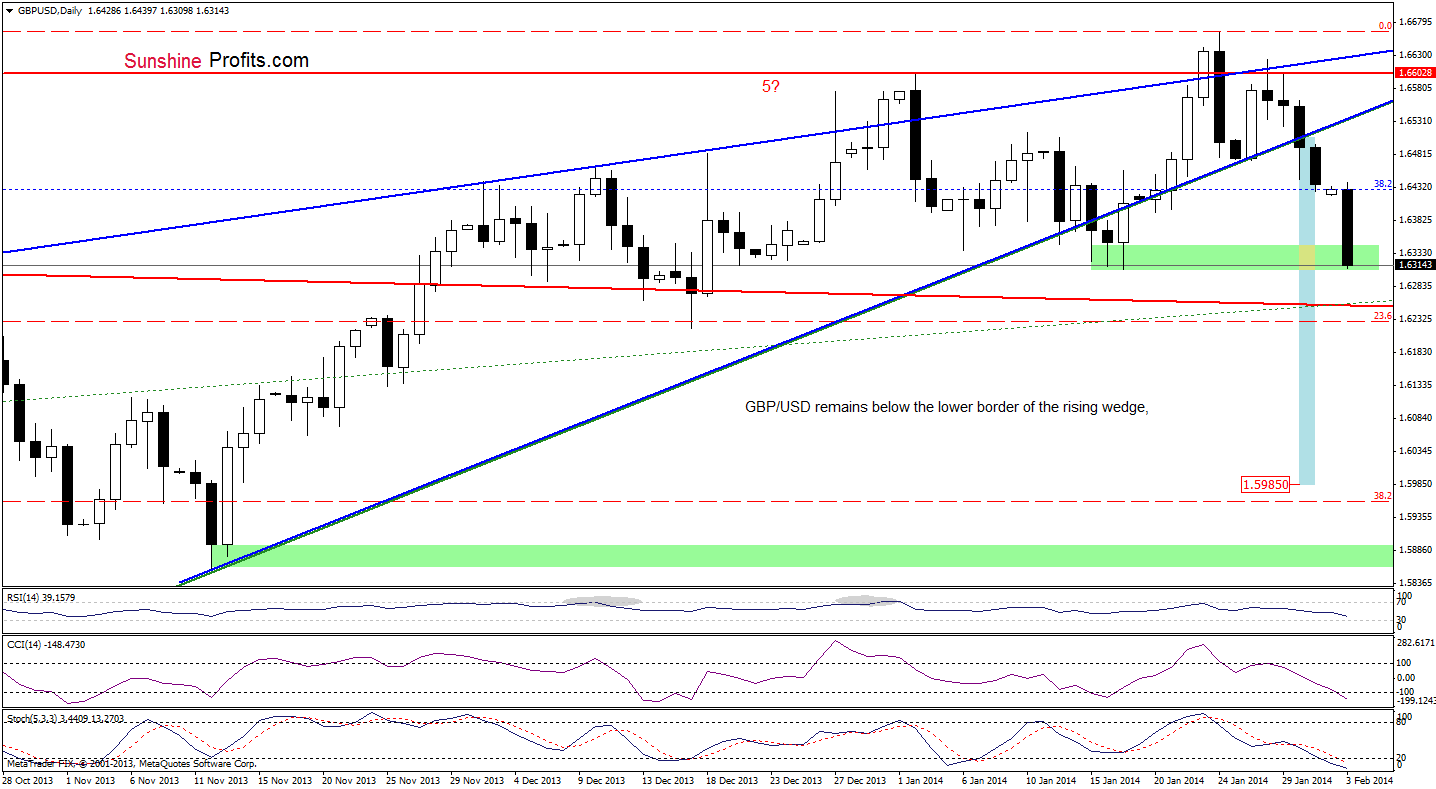
GBP/USD
Quoting our last Forex Trading Alert:
(…) GBP/USD remains below the lower border of the rising wedge (…) if the breakdown is confirmed, we will likely see further deterioration and the first downside target for the sellers will be the January low at 1.6308.
On the above chart, we see that the pair confirmed the breakdown below the lower border of the rising wedge, which triggered a sharp decline that took GBP/USD to its first downside target. At this point, we should consider two scenarios. If this support level encourages the buyers to push the order button, we will likely see a corrective upswing. However, if it is broken, we will see further deterioration and the next target for the sellers will be the long-term declining support line (marked with red). Such a confirmation might make us consider opening short positions. Please note that the latter (bearish case) is reinforced by the position of the indicators.
Very short-term outlook: bearish
Short-term outlook: mixed with bearish bias
MT outlook: mixed
LT outlook: mixed
Trading position (short-term): In our opinion no positions are justified from the risk/reward perspective. We will keep you informed should anything change, or should we see a confirmation/invalidation of the above.
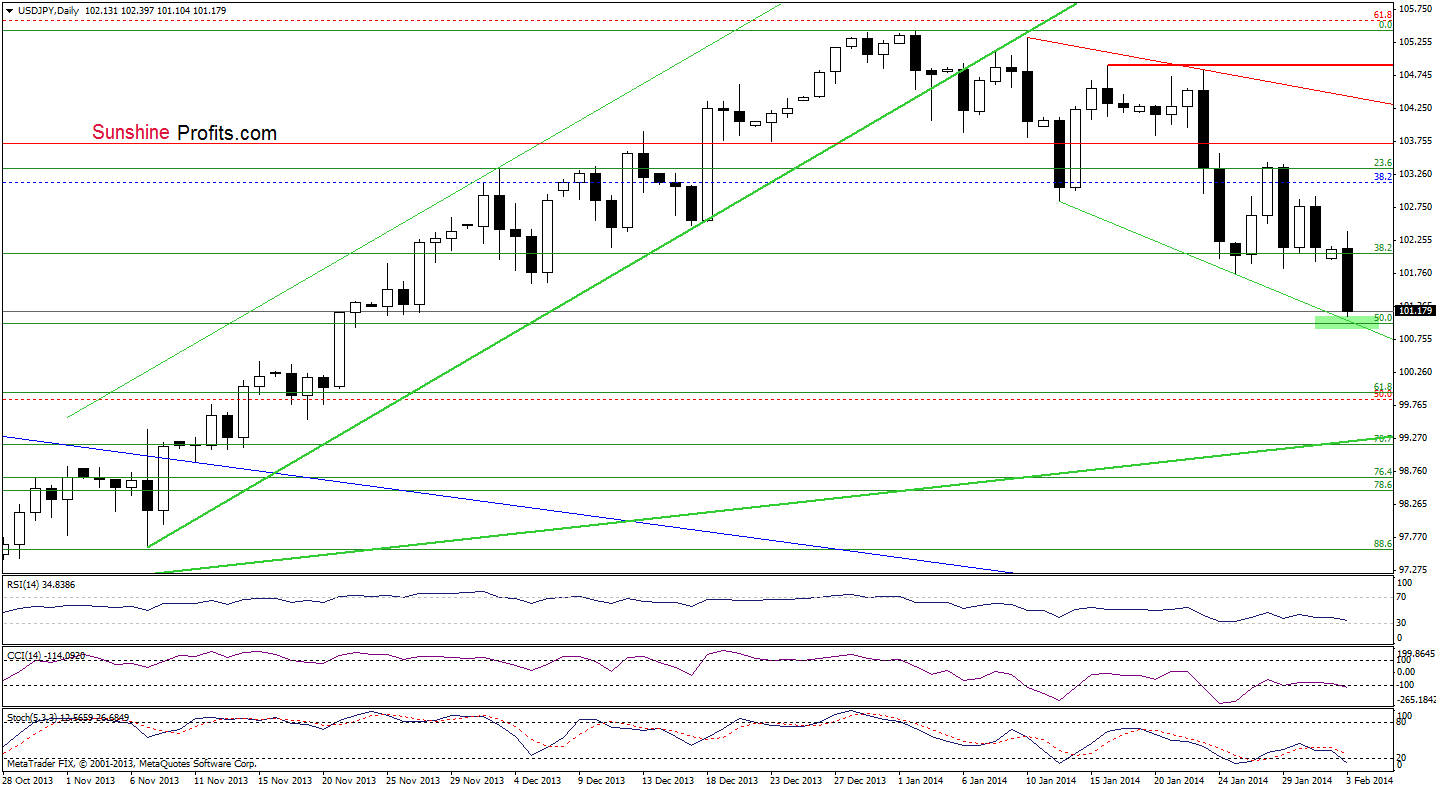
USD/JPY
In our last Forex Trading Alert, we wrote:
(…) USD/JPY remains in a consolidation (between Wednesday low and high) slightly above the 38.2% Fibonacci retracement level. If this support level encourages the buyers to act we will likely see a corrective upswing to the upper line of the consolidation range. However, if the buyers fail and the pair drops below the January low, we will likely see further deterioration. In this case, the downside target for the sellers will be the next Fibonacci retracement level at 100.99.
As you see on the above chart, we noticed such price action earlier today. The pair broke below the January low and almost reached the 50% Fibonacci retracement level. With this downswing, USD/JPY also reached the declining support line (marked with green) based on recent lows. If this support zone encourages buyers, we may see a corrective upswing. However, if it is broken, we will likely see further deterioration and the next target will be the 61.8% Fibonacci retracement at 99.61.
Very short-term outlook: bearish
Short-term outlook: mixed with bearish bias
MT outlook: bullish
LT outlook: bearish
Trading position (short-term): In our opinion no positions are justified from the risk/reward perspective. We will keep you informed should anything change, or should we see a confirmation/invalidation of the above.
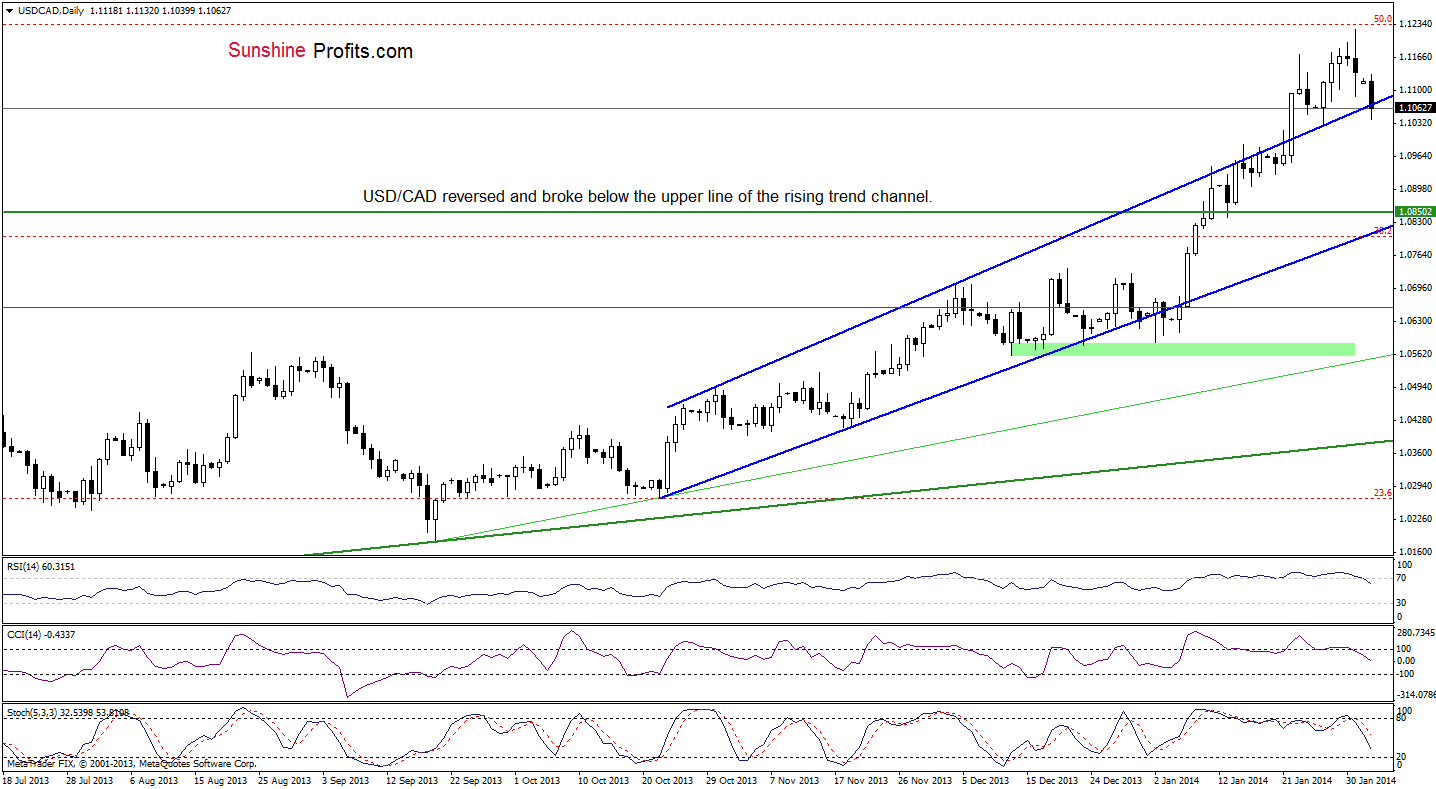
USD/CAD
Quoting our last Forex Trading Alert:
(…) USD/CAD extended gains and hit a fresh four and a half year high. With this upswing, the pair almost reached the 50% Fibonacci retracement level (based on entire 2009-2011 decline) (…) if this resistance level encourages the sellers to act, we will likely see a pullback. Please note that this assumption is reinforced by the position of the indicators (the RSI and CCI remain overbought and still support the bearish case).
As you see on the above chart, we noticed such price action after our last Forex Trading Alert was posted on Friday. Earlier today, the pair extended losses and dropped below the upper line of the rising trend channel, which is not a positive signal. However, the breakdown is not confirmed at the moment. It seems that if the pair closes the day below this strong support line, we will likely see further deterioration and the first downside target for the sellers will be around 1.0952 where the Jan.22 low is. On the other hand, if the buyers managed to push the exchange rate above this line once again, we may see an upswing to Friday’s high. Nevertheless, taking into account sell signals generated by the indicators it seems that the first scenario is more likely. If we see a breakdown below the above-mentioned support line, we might consider going short.
Very short-term outlook: mixed
Short-term outlook: bullish
MT outlook: bullish
LT outlook: bearish
Trading position (short-term): In our opinion no positions are justified from the risk/reward perspective. We will keep you informed should anything change, or should we see a confirmation/invalidation of the above.
USD/CHF
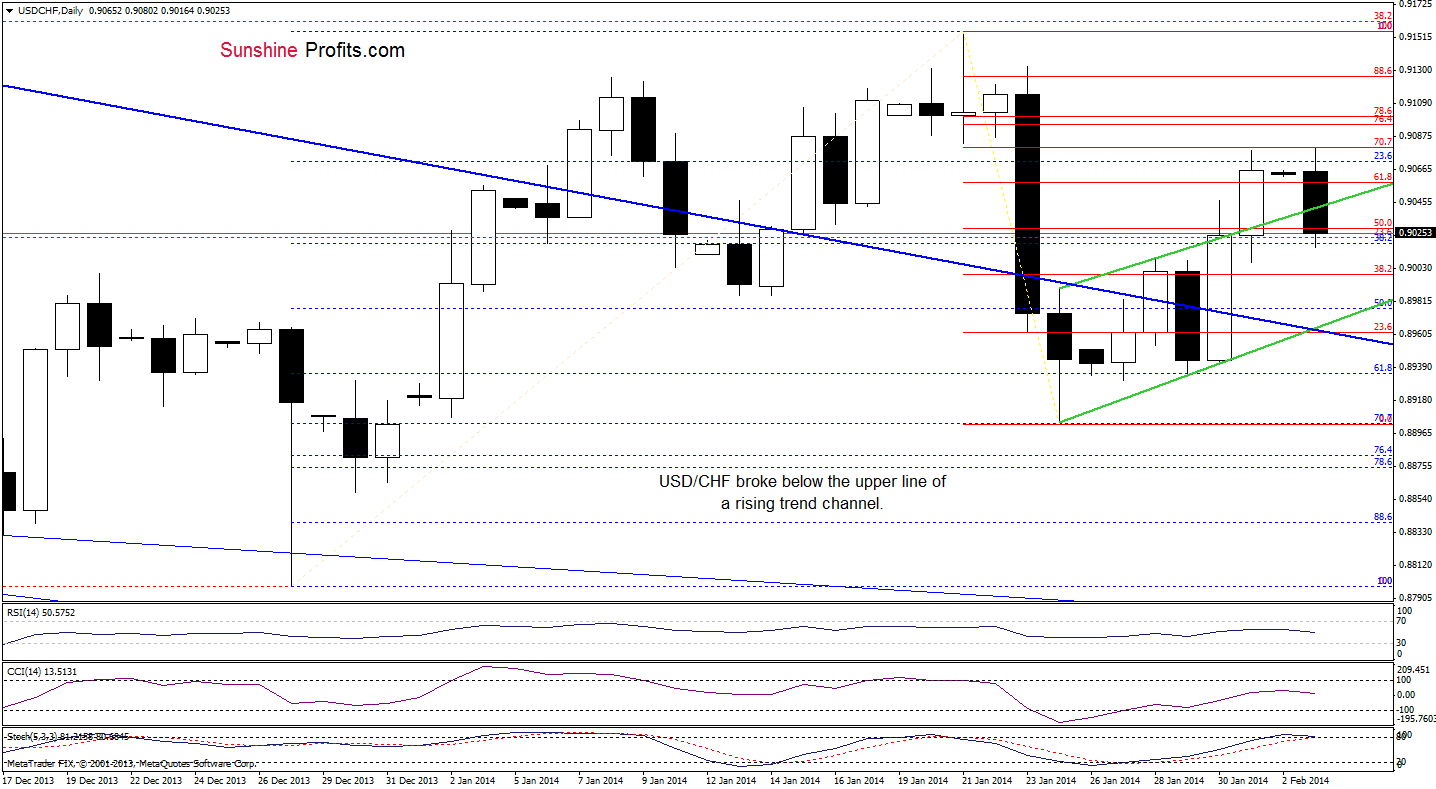
On the above chart, we see that USD/CHF reached the 70.7% Fibonacci retracement level earlier today. However, this resistance level encouraged sellers to act and triggered a pullback. With this downswing, the pair not only gave up most of Friday’s gains, but also broke below the upper line of the trend channel. An invalidation of the breakout above this support/resistance line is a bearish signal – especially when we factor in the position of the Stochastic Oscillator, which generated a sell signal.
From this perspective, it seems that further deterioration is just around the corner, and the downside target for the sellers would be the lower border of the trend channel, which intersects with the previously-broken short-term support/resistance line (marked with dark blue) at the moment.
Very short-term outlook: mixed with bearish bias
Short-term outlook: mixed
MT outlook: bearish
LT outlook: bearish
Trading position (short-term): In our opinion no positions are justified from the risk/reward perspective. We will keep you informed should anything change, or should we see a confirmation/invalidation of the above.
AUD/USD
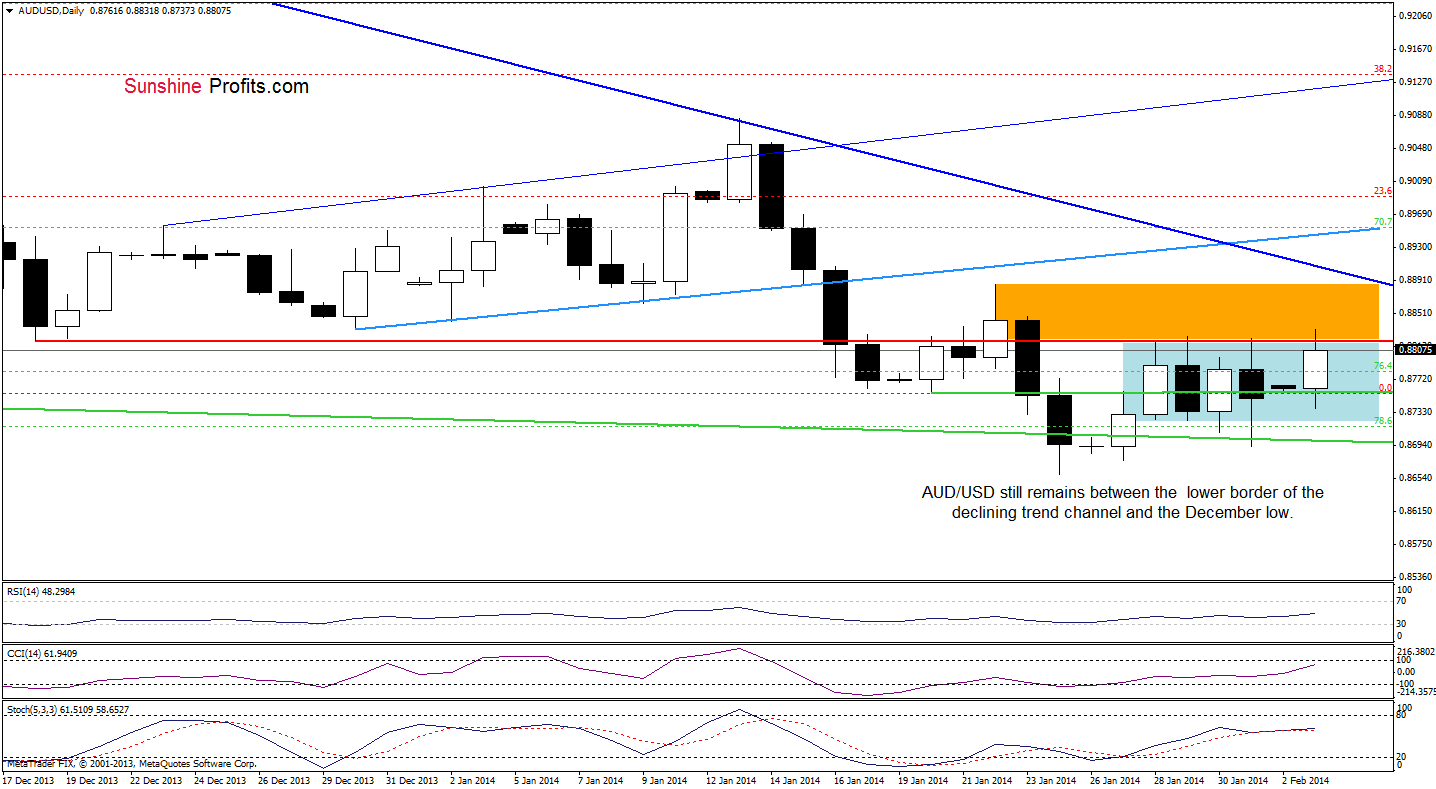
On the above chart, we see that the situation has improved slightly as AUD/USD rebounded after reaching the lower border of the declining trend channel on Friday. Although this strong support level encouraged buyers to act and triggered a corrective upswing, the pair still remains below the resistance zone created by December lows and the Jan.22 high. Taking into account the recent price action (all attempts to move above the by December low failed), it seems that another downswing can’t be ruled out.
In our opinion, the first signal of an improvement will be a breakout above the short-term declining resistance line based on the Oct.23 and Jan.13 highs (marked with dark blue) and an increase above the very short-term blue rising resistance line.
Very short-term outlook: mixed
Short-term outlook: bearish
MT outlook: bearish
LT outlook: bearish
Trading position (short-term): In our opinion, there were no significant changes that justify opening short or long positions at the moment. We will keep you informed should anything change, or should we see a confirmation/invalidation of the above.
Thank you.
Nadia Simmons
Forex & Oil Trading Strategist
Forex Trading Alerts
Oil Investment Updates
Oil Trading Alerts

