
The U.S. dollar moved lower against major currencies after a smaller-than-expected drop in the number of new unemployment claims. The Labor Department said in its report that initial claims for jobless benefits decreased by 2,000 to a seasonally adjusted 326,000 in the week ended Jan. 11 (while economists had expected 330,000 new claims for the week). It’s worth noting that this is the smallest number in six weeks. What impact did it have on major currency pairs? If you want to know our take on this question, we invite you to read our today's Forex Trading Alert.
Forex Trading Positions - Summary:
- EUR/USD: open short position with stop-loss level at 1.3699 only if EUR/USD close below 1.3588
- GBP/USD: short position (stop-loss level: 1.6515)
- USD/JPY: none
- USD/CAD: none
- USD/CHF: long position (stop-loss level: 0.8985)
- AUD/USD: none
EUR/USD
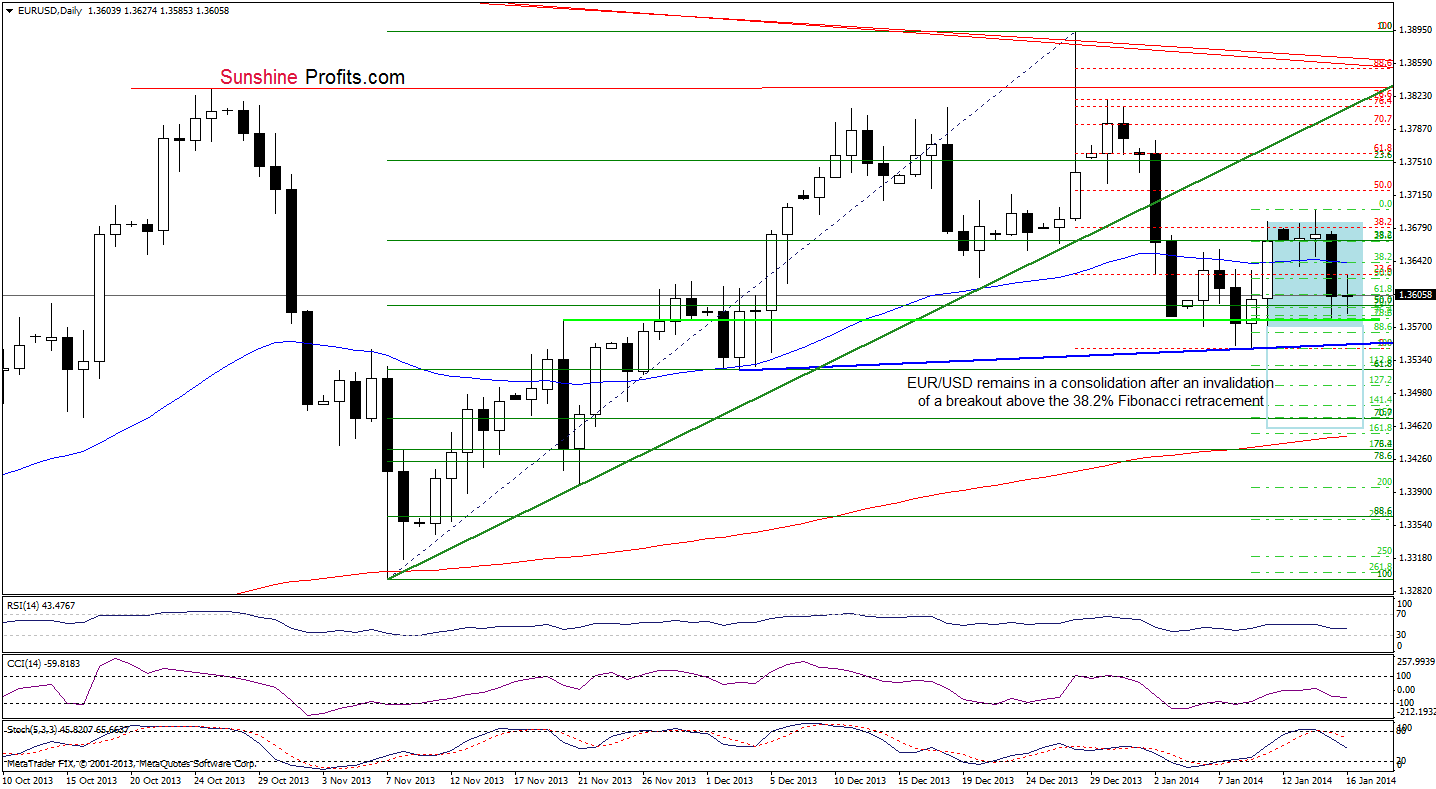
On the above chart, we see that after an invalidation of the breakout above the 38.2% Fibonacci retracement (based on the recent decline) EUR/USD dropped to the 76.4% Fibonacci retracement (based on the recent upward move). This support level encouraged buyers to push the buy button and triggered a small upswing. Despite this increase, the situation hasn’t changed much because the pair remains in a consolidation range (marked with the light blue rectangle) slightly above the medium-term rising support line (seen on the weekly chart).
Therefore, if EUR/USD declines below Friday’s low at 1.3573 (which is reinforced by the support line created by the Nov. 20 high that successfully stopped further declines in the previous week) we will likely see further deterioration – especially when we take into account the fact that such a drop will also mean a decline below the medium-term rising support line. In this case, the first downside price target will be around 1.3457 (this level intersects with the 38.2% Fibonacci retracement level based on the entire March-December rally).
Very short-term outlook: bearish
Short-term outlook: mixed with bearish bias
MT outlook: mixed
LT outlook: bearish
Trading position (short-term): if the pair closes the day below the medium-term support line, we will suggest opening short positions. The stop-loss level for this position is at 1.3699. The first downside price target is around 1.3457. We will keep you informed should anything change, or should we see a confirmation/invalidation of the above.
GBP/USD
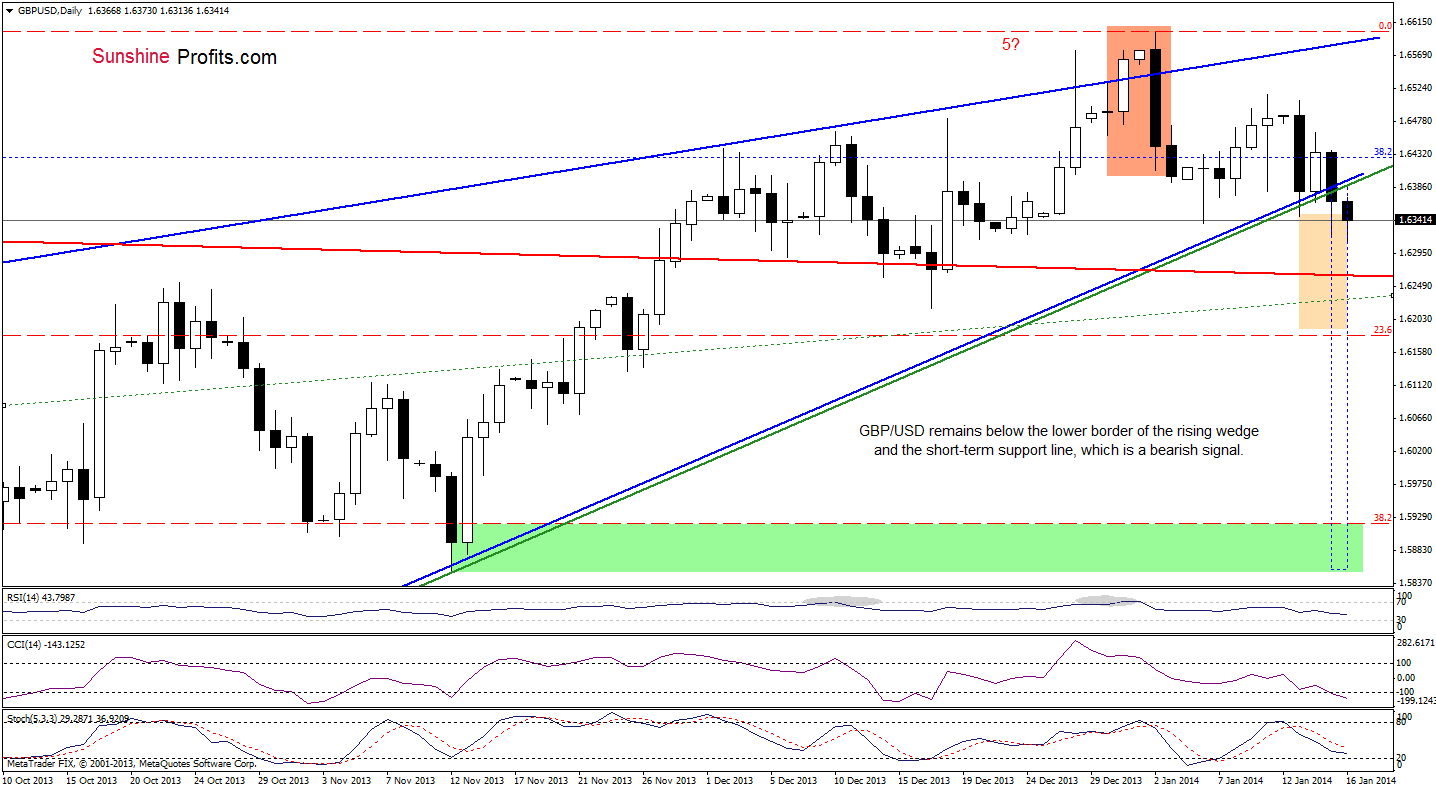
Looking at the above chart, we see that the situation has deteriorated slightly as GBP/USD extended its decline below the lower border of the rising wedge and short-term declining support line. This price action is in tune with our yesterday’s bearish scenario, therefore, what we wrote in our last Forex Trading Alert remains up-to-date.
(…) the pair dropped below Monday’s low (…), which will likely trigger further deterioration and the price target for the pattern will be slightly above the 23.6% Fibonacci retracement level based on the entire Jul.-Jan. rally (marked with a lighter rectangle). This bearish scenario is quite likely – especially when we factor in sell signals generated by the indicators and a possible rising 5-wave sequence (in our opinion wave 5 may be already over).
Please note that the breakdown below the lower border of the rising wedge will likely trigger a bigger corrective move (and we will likely see a breakdown below the red long-term support line). If that is the case, the price target for this formation will be slightly below the 38.2% Fibonacci retracement level based on the entire Jul.-Jan. rally (marked in dark blue).
Very short-term outlook: bearish
Short-term outlook: bearish
MT outlook: mixed
LT outlook: mixed
Trading position (short-term): short. The stop-loss level for this position is at 1.6515. The first downside price target is around 1.6190. We will keep you informed should anything change, or should we see a confirmation/invalidation of the above.
USD/JPY
Quoting our previous Forex Trading Alert:
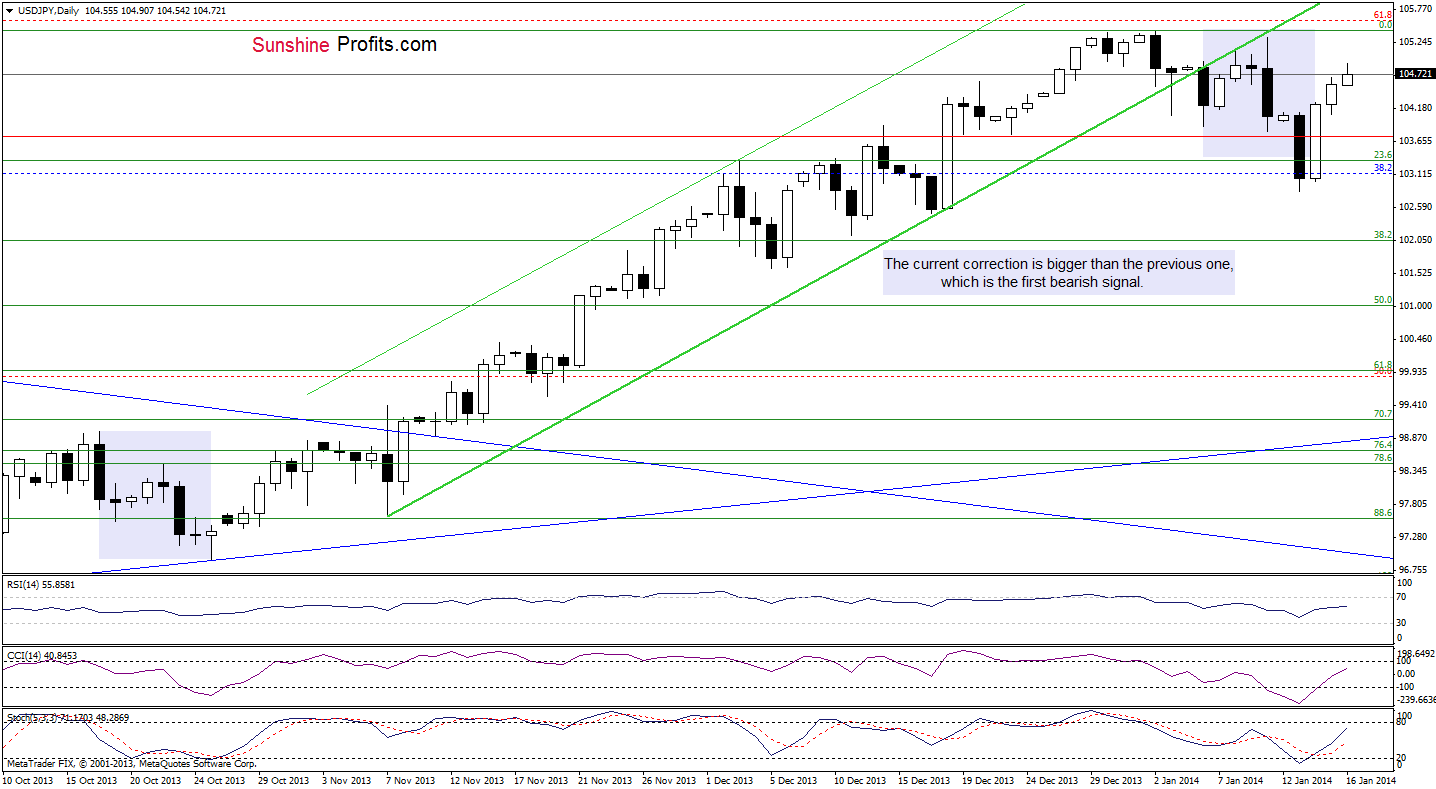
(…) USD/JPY extended yesterday’s strong rally and invalidated the breakdown below intra-day lows, which is a bullish signal. In this case, we could see further improvement and the first price target will be Friday’s high. As you see on the above chart, the CCI and Stochastic Oscillator generated buy signals, which supports the above assumption.
As you see on the above chart, the pair has continued its rally yesterday and also earlier today. However, it didn’t reached its first price target (at least at the moment when these words are written). Additionally, we clearly see that the bodies of the consecutive white candlesticks are getting smaller, which suggests that the strength of the buyers waned in the recent days. If this is the case, and USD/JPY closes the day below 104.91 we will likely see a pause or even a pullback in the coming days.
We should keep in mind that although the pair increased, it still remains below the previously-broken short-term rising line (the breakdown is confirmed), which will likely stop further improvement (similarly to what we saw in the previous week). On top of that, slightly below this line is the 61.8% Fibonacci retracement level, which supports the sellers. Connecting the dots, even if we see a continuation of a rally, the space for further growth seems limited.
Very short-term outlook: mixed
Short-term outlook: mixed
MT outlook: bullish
LT outlook: bearish
Trading position (short-term): we do not suggest opening any trading positions at the moment. We will keep you informed should anything change, or should we see a confirmation/invalidation of the above.
USD/CAD
In our last Forex Trading Alert we wrote the following:
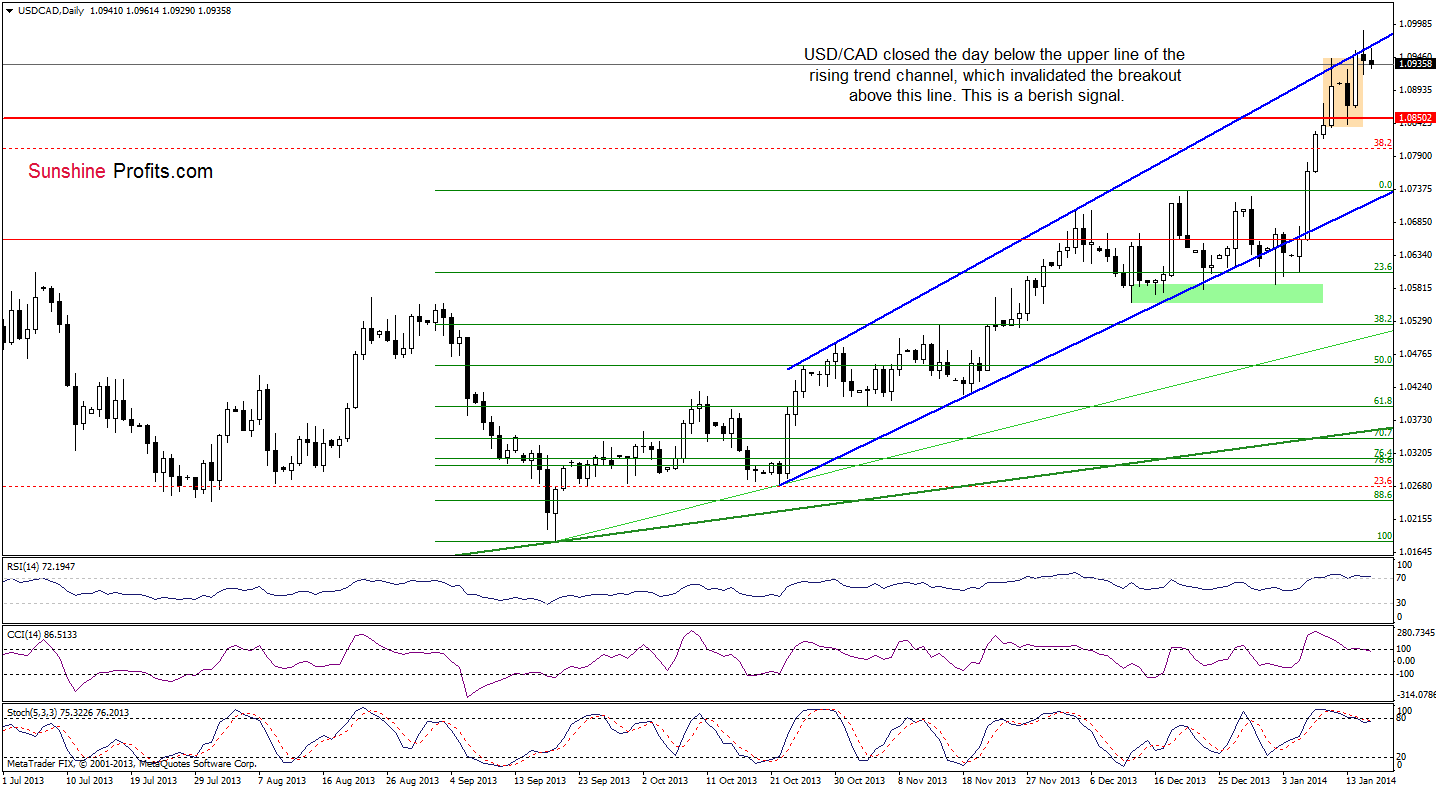
(…) the pair slipped slightly below the upper line of the rising trend channel, which is not a positive signal. Therefore, if USD/CAD closes the day below this line, we will have an invalidation of the breakout, which will be a bearish signal. Please note that such price action in combination with the position of the indicators will likely encourage the sellers to act and stop further improvement.
Looking at the above chart, we see that we had such price action and a small breakout above the upper line of the rising trend channel was invalidated. This negative event triggered a decline and it seems that further deterioration is just around the corner. On top of that, the RSI is still overbought and two other indicators generated sell signals supporting bearish case.
Very short-term outlook: mixed with bearish bias
Short-term outlook: bullish
MT outlook: bullish
LT outlook: bearish
Trading position (short-term): we do not suggest opening short positions yet because the pair didn’t invalidate a small breakout above the long-term declining support/resistance line on the weekly chart and it still serves as support. We will keep you informed should anything change, or should we see a confirmation/invalidation of the above.
USD/CHF
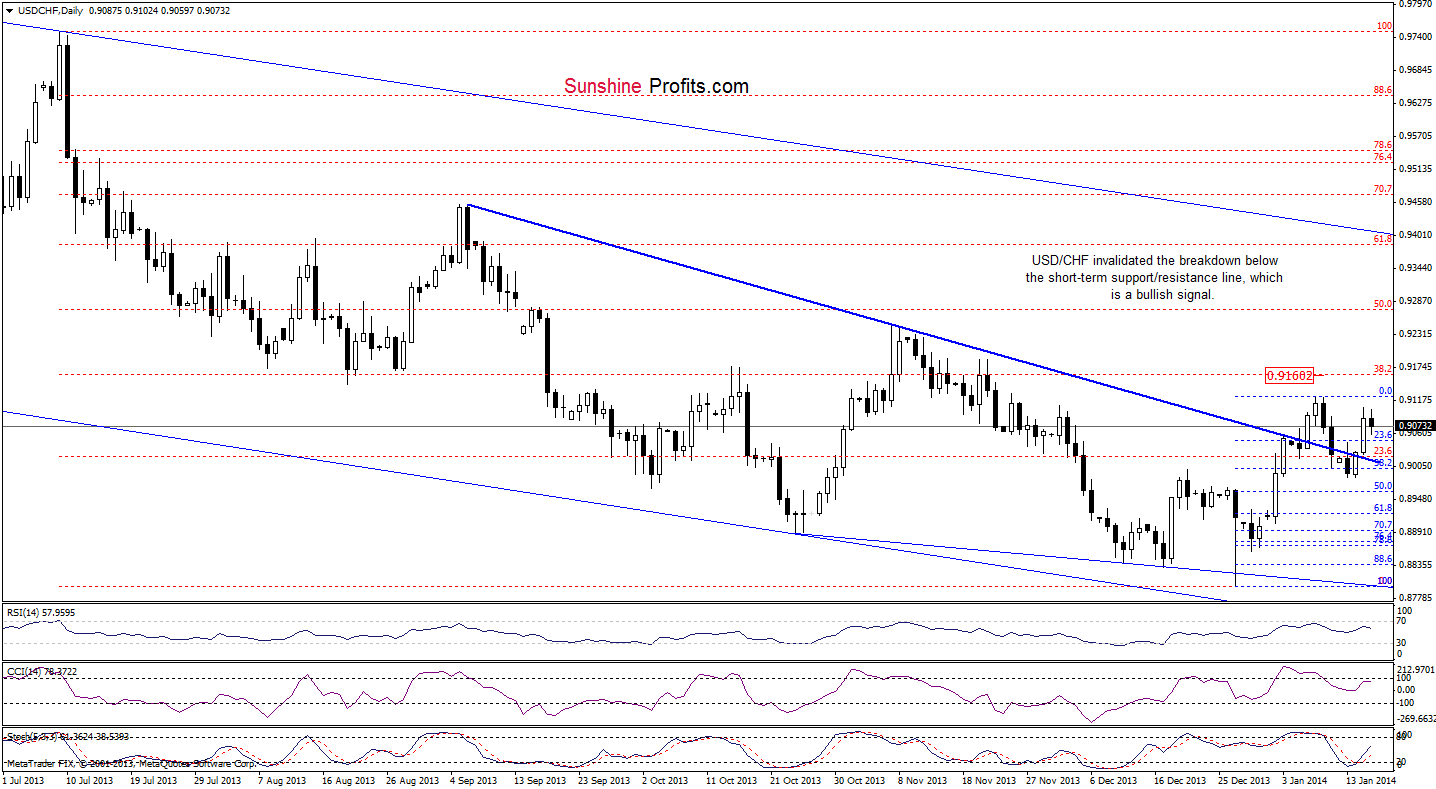
Looking at the above chart, we see that after an invalidation of the breakdown below the short-term declining support/resistance line (which was a strong bullish signal) USD/CHF increased and approached its first upside target (the Jan. 8 high). Yesterday’s increase was quite sharp; therefore, small pause that we see at the moment is not a surprise. As you see on the daily chart, the RSI and CCI are not overbought and a buy signal generated by the Stochastic Oscillator remains in place supporting buyers.
Very short-term outlook: bullish
Short-term outlook: bearish
MT outlook: bearish
LT outlook: bearish
Trading position (short-term): long. The stop-loss level for this position is at 0.8985. The upside price target is around 0.9160. We will keep you informed should anything change, or should we see a confirmation/invalidation of the above.
AUD/USD
In our last Forex Trading Alert we wrote:
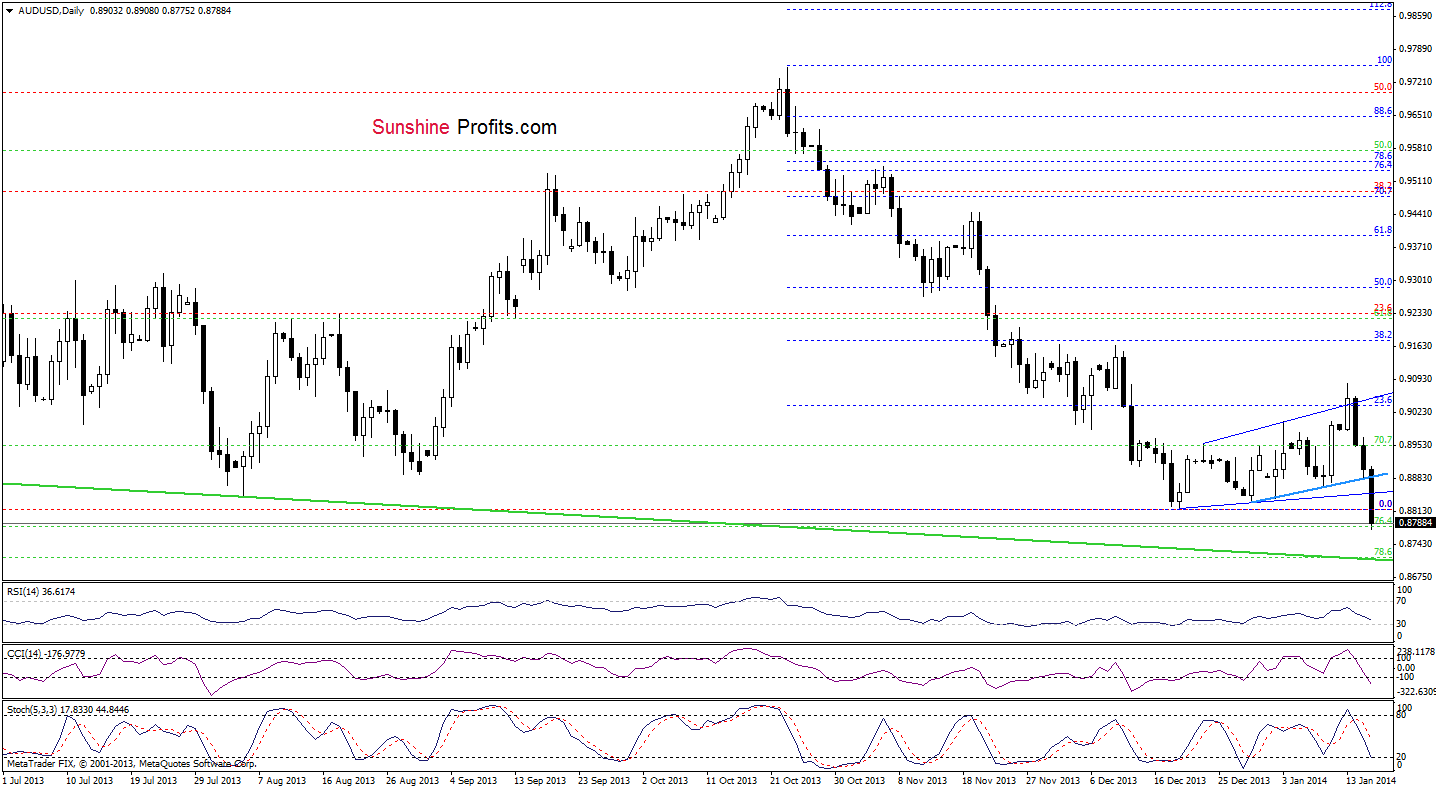
(...) an invalidation of the breakout is a bearish signal. Therefore, from this perspective, it seems that we will see further deterioration – especially when we take into account the fact that the pair has corrected less than 30% of the entire decline and that sell signals have been generated by the CCI and Stochastic Oscillator.
However, we should keep in mind that the pair reached the very short-term support line with the recent downswing, therefore, we may see a pause or an upward correction from here. Please note that if the pair breaks below this support line, we will likely see further deterioration and the first downside target will be the December low.
On the above chart, we see that AUD/USD broke below the very short-term support line, which triggered a sharp decline that took the pair not only to the December low, but also a new annual low (at the 76.4% Fibonacci retracement level).
If this support buyers, we will likely see an upward correction from here. However, taking into account the position of the indicators, it seems that the bearish scenario is more likely. If this is the case, we will likely see further deterioration and the next price target will be the 78.6% Fibonacci retracement, which intersects with the lower border of the declining trend channel (you can see it more clearly on the weekly chart below).
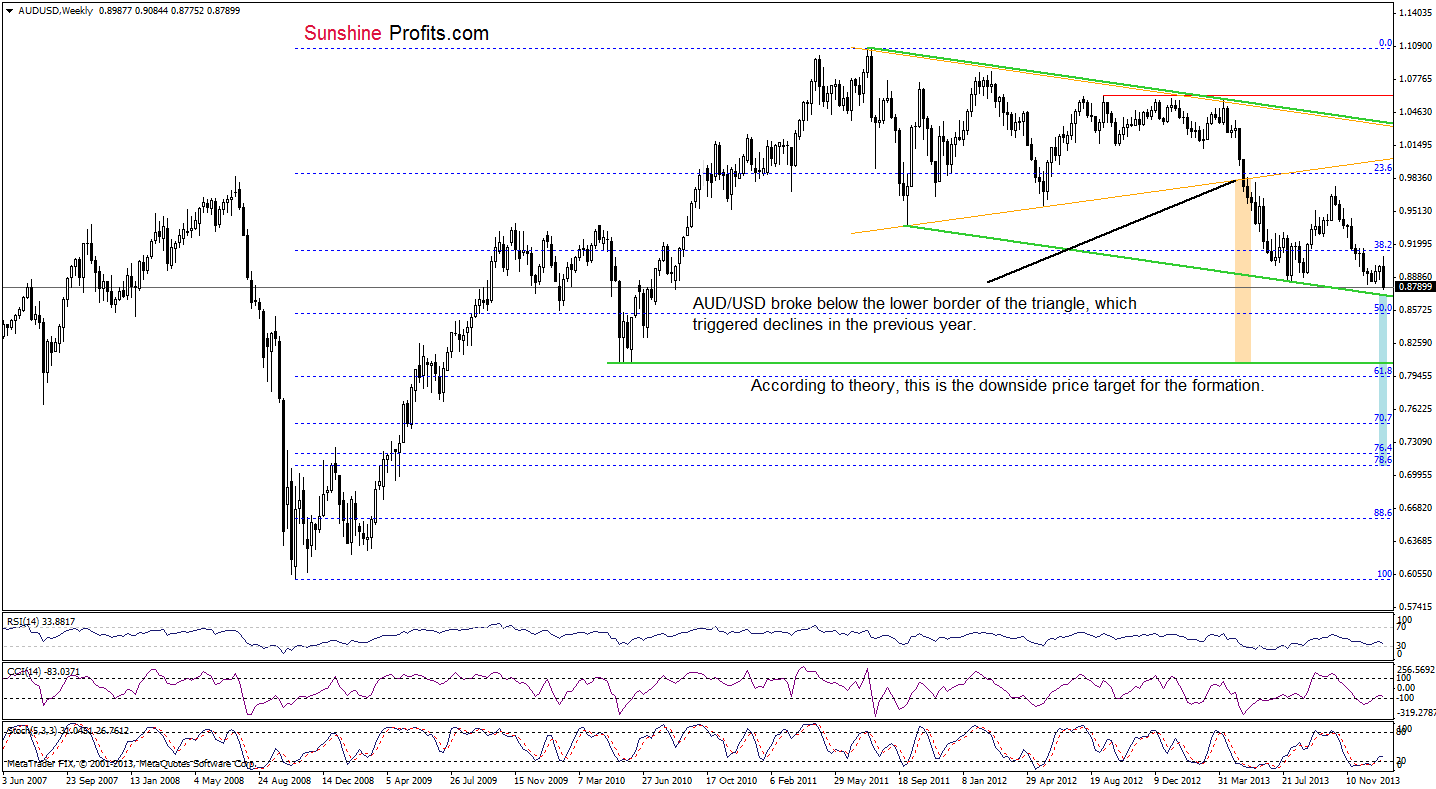
From this perspective, it seems that the space for further declines is limited because a strong support zone (slightly below the current level) may pause or even stop further deterioration. This assumption is reinforced by buy signals generated by the CCI and Stochastic Oscillator.
Very short-term outlook: bearish
Short-term outlook: bearish
MT outlook: bearish
LT outlook: bearish
Trading position (short-term): we do not suggest opening short positions at the moment because it seems that the space for further declines is limited by the strong support zone created by the 78.6% Fibonacci retracement and the lower border of the declining trend channel. We will keep you informed should anything change, or should we see a confirmation/invalidation of the above.
Thank you.
Nadia Simmons
Forex & Oil Trading Strategist
Forex Trading Alerts
Oil Investment Updates
Oil Trading Alerts

