-
Time for a Rebound in USD/CAD?
January 7, 2020, 11:00 AMUSD/CAD
The Canadian dollar has been going from strength to strength recently, but isn't it time for the greenback to stage a comeback? Let's examine the story the technicals tell...
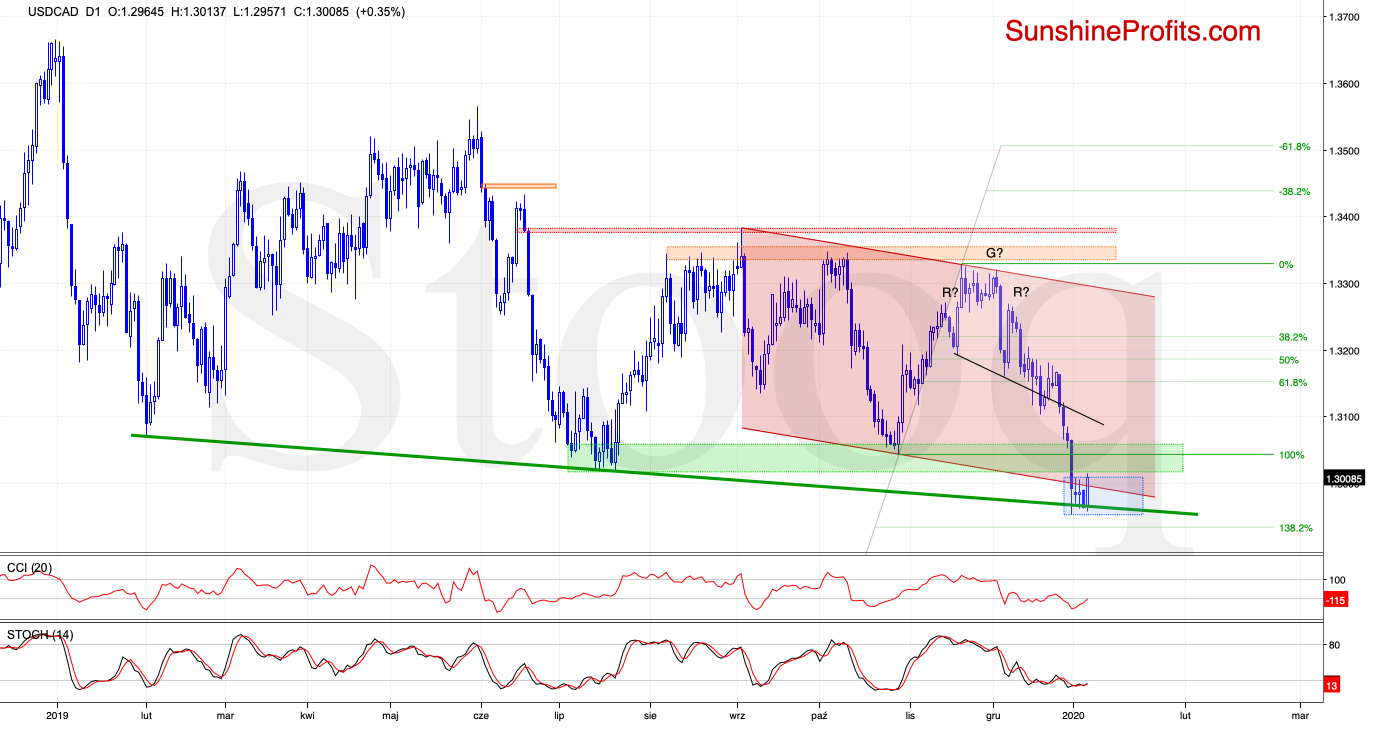
The first thing that catches the eye on the above chart, is the drop to the long-term green support line based on the previous lows.
When we take a closer look at the chart below, we can see that although the exchange rate moved a bit below this support line, the bulls responded by pushing the pair higher, resulting in the invalidation of the earlier tiny breakdown.
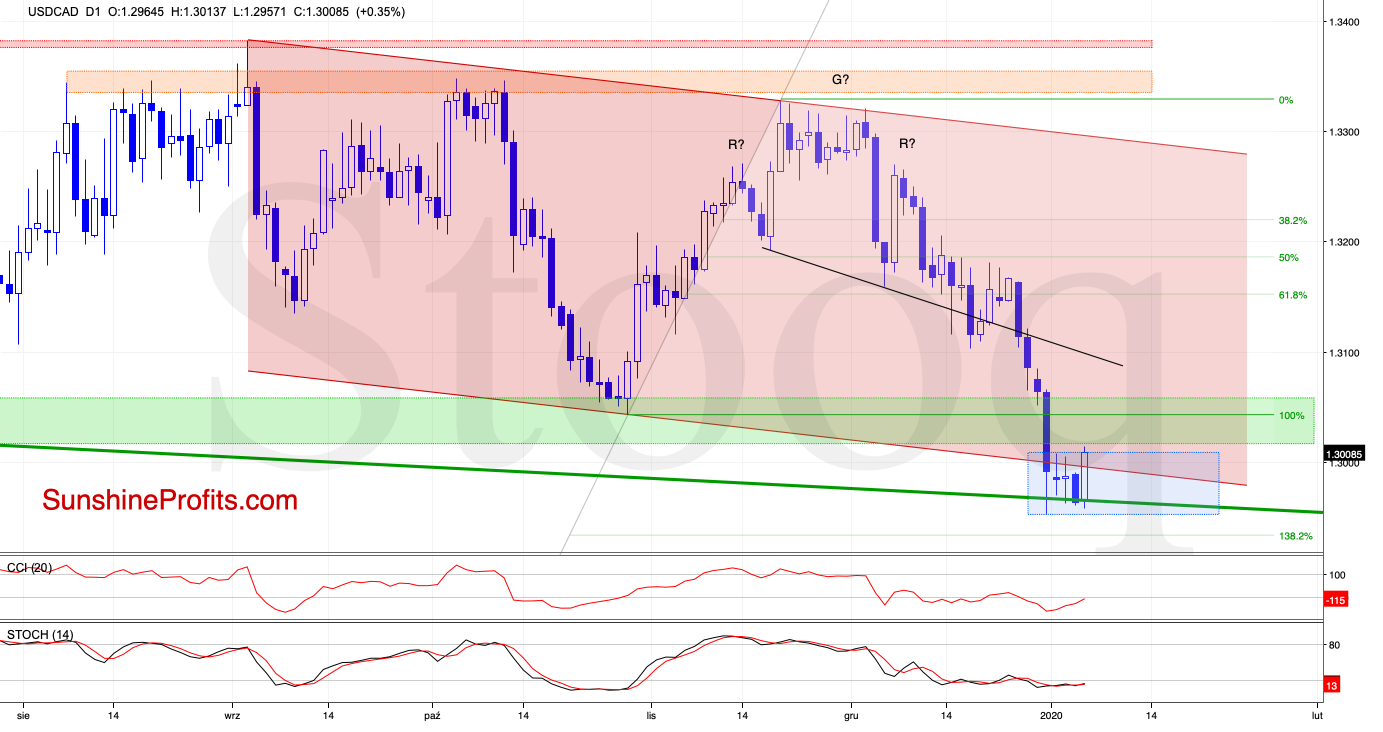
Earlier today, we noticed another move to the upside, which not only invalidated yesterday's drop below the green line, but also the earlier breakdown below the lower border of the declining red trend channel. Both of these invalidations are bullish signs.
Additionally, the current position of the daily indicators suggests that further improvement is just around the corner. Should this be the case and USD/CAD extends gains from here, the initial upside target will be the previously broken black line - that is the neck line of the head and shoulders formation.
Taking all the above into account, opening long positions is justified from the risk/reward perspective. All details below.
We hope you enjoyed reading the above free analysis, and we encourage you to read today's Forex Trading Alert - this analysis' full version. There, we discuss also the current situation in EUR/USD. The full Alert includes more details about our current positions and levels to watch before deciding to open any new ones or where to close existing ones. There's no risk in subscribing right away, because there's a 30-day money back guarantee for all our products, so we encourage you to subscribe today.
-
USD/JPY - Light at the End of the Tunnel?
January 6, 2020, 10:26 AMUSD/JPY
USD/JPY can't seem to find the bottom after swinging down steeply in recent days. Or will today's price action turn out to be a meaningful turnaround?
Let's recall our Tuesday's commentary:
(...) Today's downswing brought the exchange rate below the black support line that is based on previous lows. It suggests that further deterioration may be just around the corner - especially when we factor in the sell signals generated by the daily indicators.
If this is the case and the pair extends losses from here, where could the bears aim to go? We would likely see not only a test of the next green support zone based on the mid-November lows, but also a test of the lows created at the turn of October and November, which is where our initial downside target currently is.
There's one more thing, and it's the head and shoulders formation in the making. The exchange rate dropping below the lower black support line (that would be the neck line) could trigger a move even to around 107.32. This is where the size of the downward move would correspond to the height of the head-and-shoulders formation.
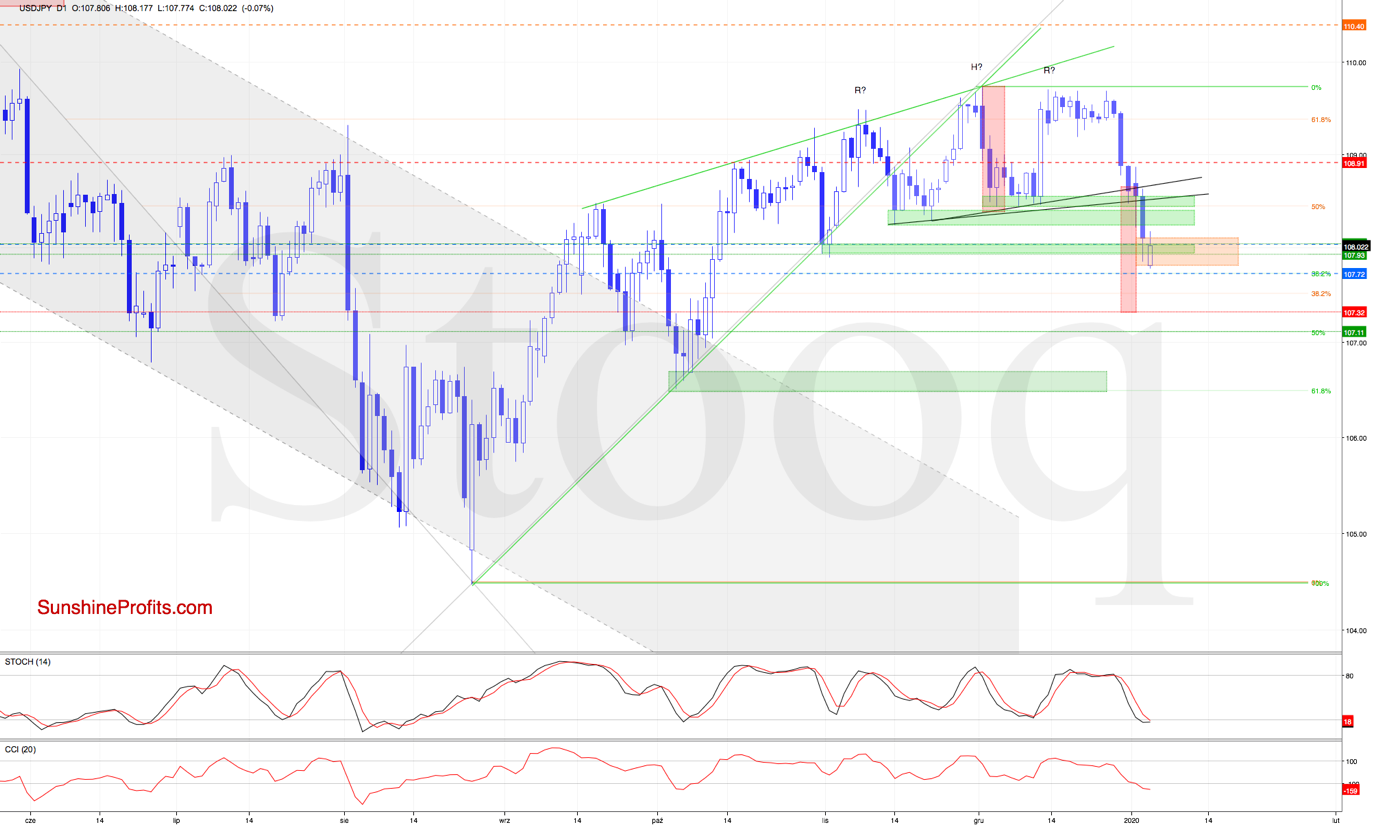
USD/JPY has indeed moved sharply lower after the breakdown below the black support lines based on the previous lows, making our short positions even more profitable.
This decline brought the exchange rate below the mentioned green support zone, which doesn't bode well for the bulls - especially when we factor in today's bearish orange gap.
While the buyers pushed the pair higher to trade above 108.00, the exchange rate is still trading not only below the upper border of the gap, but also below the previously broken green line. This suggests that today's rebound could be nothing more than a verification of the earlier breakdown.
Additionally, there are no buy signals at the moment that could encourage the buyers to act. Connecting the dots, as long as the gap is open, another attempt to move lower should not surprise us. The downswing would be supported by the above-mentioned head and shoulders formation.
Therefore, we decided to move our stop-loss order lower to protect some of our gains, and move lower our downside target at the same time. All details below.
We hope you enjoyed reading the above free analysis, and we encourage you to read today's Forex Trading Alert - this analysis' full version. There, we discuss also the current situation in EUR/USD and GBP/USD. The full Alert includes more details about our current positions and levels to watch before deciding to open any new ones or where to close existing ones. There's no risk in subscribing right away, because there's a 30-day money back guarantee for all our products, so we encourage you to subscribe today.
-
Taking Advantage of the AUD Bulls' Waning Strength
January 2, 2020, 10:44 AMAUD/USD
Seemingly unstoppable, the Australian dollar has been on a winning streak recently. Yet the bulls wavered in their efforts not so long ago. Is it a sign that the tide is beginning to turn? Or, is it turning already?
We wrote on Monday that the recent AUD/USD upswing:
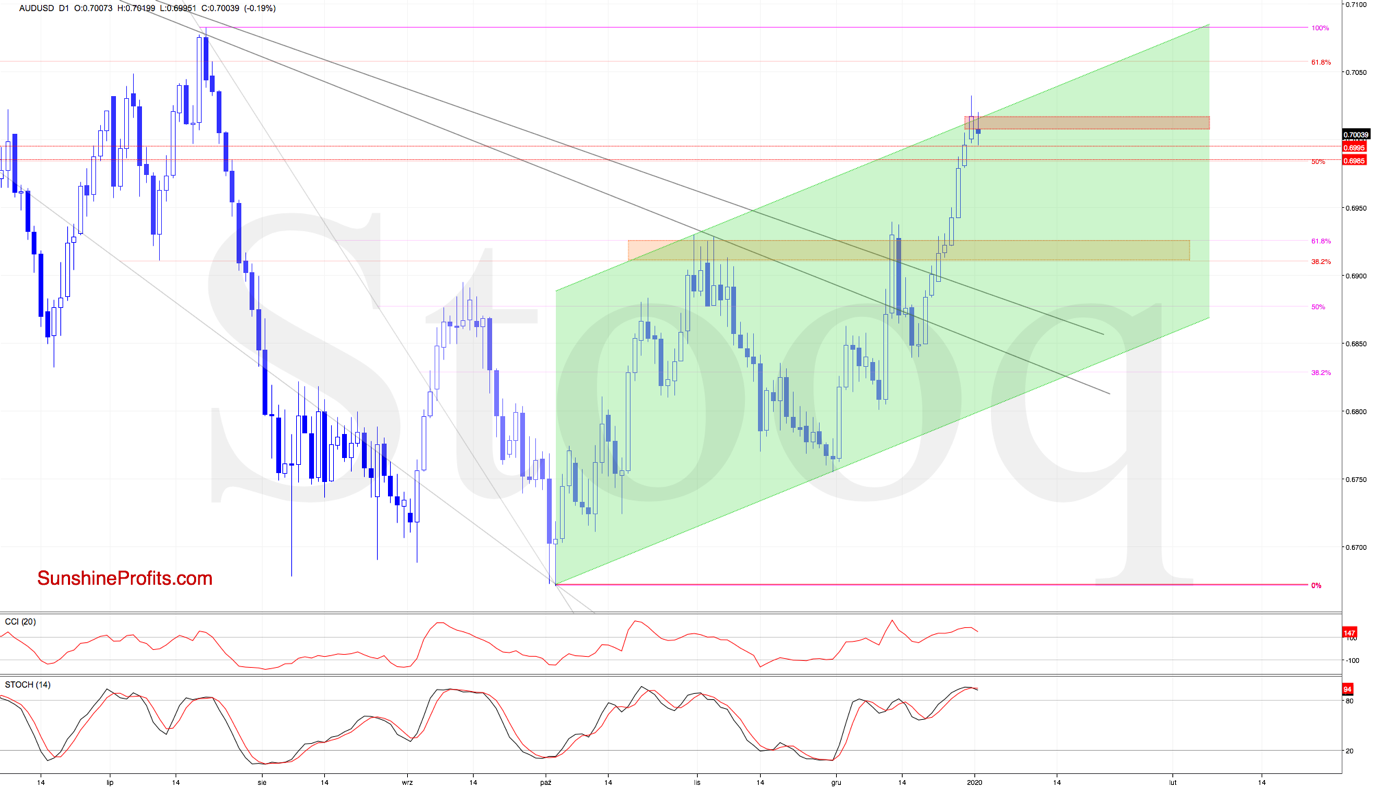
(...) brought the pair back above the two declining resistance lines, opening the way for further gains and to the resistance zone created by the 76.4% and 78.6% Fibonacci retracements.
Earlier today, the pair reached this area, and as the daily indicators haven't flashed any sell signals, it increases the likelihood of further improvement and a test of the upper border of the rising green trend channel in the very near future.
The situation developed in line with the above, and the pair overcame the mentioned resistance line on Tuesday. The bulls however didn't manage to keep all the ground gained, and a lower open followed earlier today. This means that a bearish gap has been created, invalidating the earlier breakout above the rising green trend channel.
This is certainly a bearish development that increases the probability of further deterioration in the coming days. But such price action will be more likely and reliable only if we see a daily close inside the channel coupled with the daily indicators generating their sell signals.
Should we see such price action, we'll consider opening short positions.
We hope you enjoyed reading the above free analysis, and we encourage you to read today's Forex Trading Alert - this analysis' full version. There, we discuss also the current situation in EUR/USD and USD/CHF. The full Alert includes more details about our current positions and levels to watch before deciding to open any new ones or where to close existing ones. There's no risk in subscribing right away, because there's a 30-day money back guarantee for all our products, so we encourage you to subscribe today.
-
Japanese Yen Goes From Strength to Strength. Not Unexpectedly
December 31, 2019, 10:00 AMUSD/JPY
Having traded in a tight range recently, USD/JPY has broken down yesterday. The momentum goes on and the pair's losses keep mounting. Let's explore what kind of change in outlook have these moves brought.
Let's recall our yesterday's observations as they're still up-to-date:
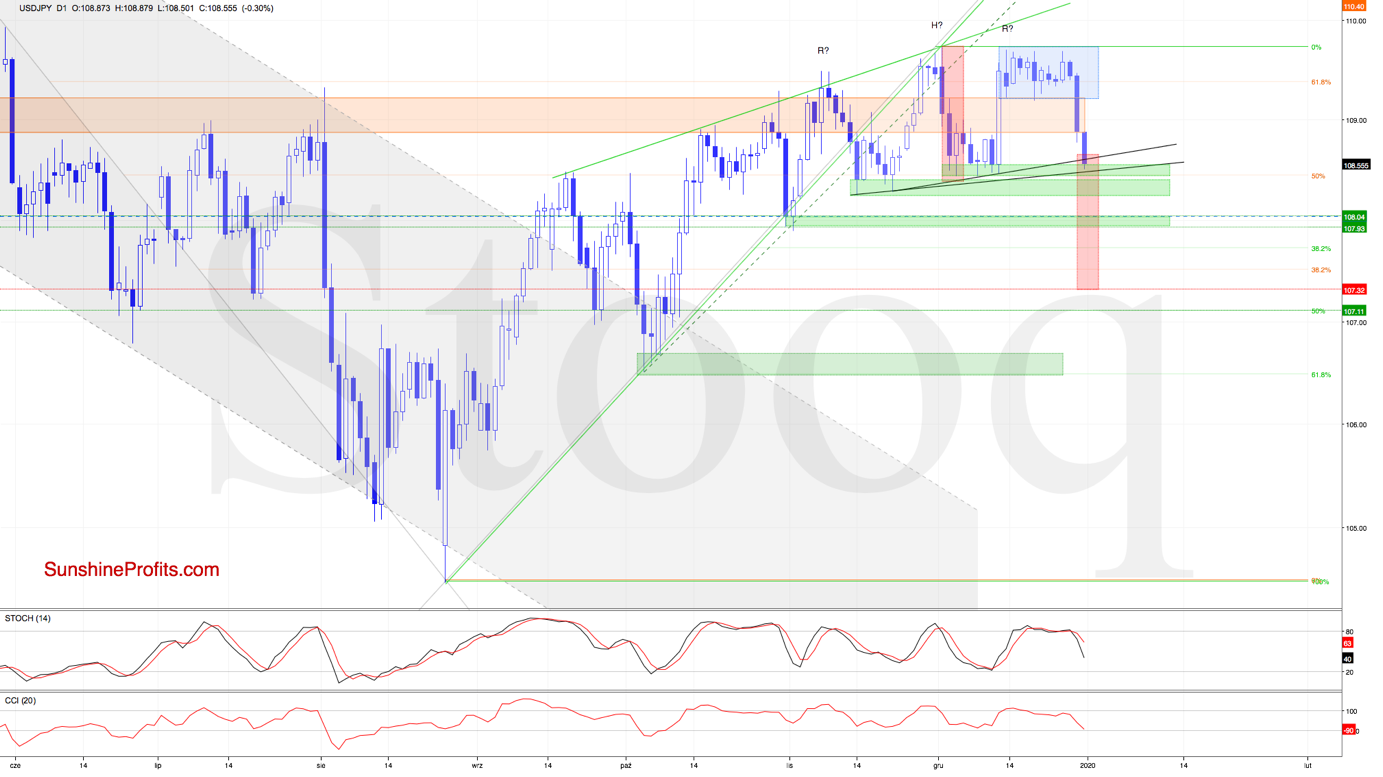
(...) the exchange rate is still trading below the rising green wedge, which suggests that another reversal may be just around the corner. This is especially the case when we factor in a potential head-and-shoulders formation.
Should it be the case and the pair moves lower from here, thus creating the right arm of the formation, the first downside target will be the support area created by the early December lows.
The situation has indeed developed in tune with our assumptions, and USD/JPY moved sharply lower after our yesterday's Alert was posted.
Earlier today, the pair extended losses, making our short positions even more profitable. Today's downswing brought the exchange rate below the black support line that is based on previous lows. It suggests that further deterioration may be just around the corner - especially when we factor in the sell signals generated by the daily indicators.
If this is the case and the pair extends losses from here, where could the bears aim to go? We would likely see not only a test of the next green support zone based on the mid-November lows, but also a test of the lows created at the turn of October and November, which is where our initial downside target currently is.
There's one more thing, and it's the head and shoulders formation in the making. The exchange rate dropping below the lower black support line (that would be the neck line) could trigger a move even to around 107.32. This is where the size of the downward move would correspond to the height of the head-and-shoulders formation.
We hope you enjoyed reading the above free analysis, and we encourage you to read today's Forex Trading Alert - this analysis' full version. There, we discuss also the current situation in EUR/USD and GBP/USD. The full Alert includes more details about our current positions and levels to watch before deciding to open any new ones or where to close existing ones. There's no risk in subscribing right away, because there's a 30-day money back guarantee for all our products, so we encourage you to subscribe today.
Free Gold &
Forex Newsletter
with details not available
to 99% investors
+ 7 days of Gold Alerts
Gold Alerts
More-
Status
New 2024 Lows in Miners, New Highs in The USD Index
January 17, 2024, 12:19 PM -
Status
Soaring USD is SO Unsurprising – And SO Full of Implications
January 16, 2024, 8:40 AM -
Status
Rare Opportunity in Rare Earth Minerals?
January 15, 2024, 2:06 PM
Metals charts