
Based on the June 10th, 2011 Premium Update. Visit our archives for more gold & silver articles.
Recently, we had received a question from one of our Subscribers and we consider it to be of most importance at this market juncture. The question was:
Do you see a sharp pullback coming for commodities in general over the summer months?
In short yes, we believe that the commodities move lower during the summer months. We would expect the precious metals to decline and enter a period which could be termed the summer doldrums. This appears likely to last through the month of August but this is simply our best guess at this time. The exact timing is truly unknown. The problems surrounding the coming significant declines do, however, appear to be quite profound.
The seasonal tendencies appear to play out in a way that is very similar to what weve seen many times in the previous years. Naturally, these are just tendencies not sure bets, but it seems that other signals from the market support them.
Lets have more insight on the bearish trend by analyzing the current market technicals. We will begin with the gold charts (charts courtesy by http://stockcharts.com.)
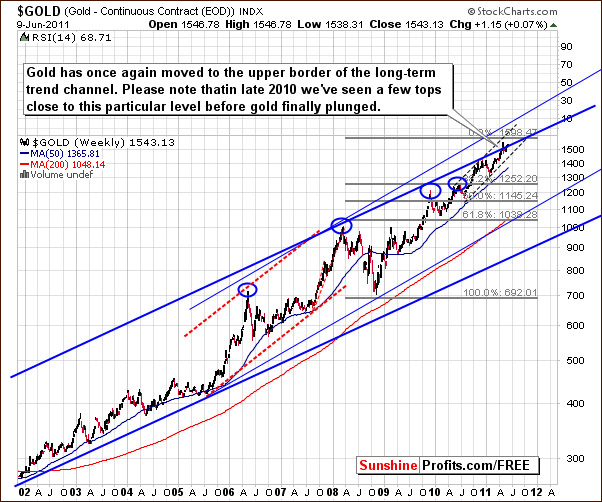
In the very long-term chart for gold, we have seen yet another attempt to move above the rising trend channel. This will probably not succeed and will likely be quite similar to what was seen in late 2010. At that time, a period of sideways price movement near the upper border of the trading channel was followed by declining prices.
Lets zoom in for more details.
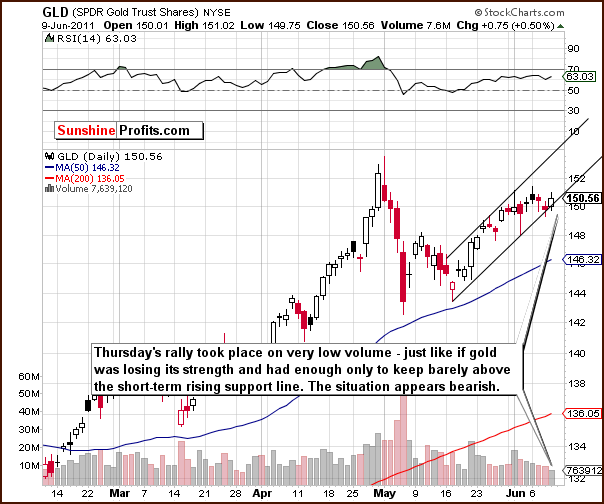
Last week GLD ETF has moved rather insignificantly higher (until Thursday that is). On Thursday, golds price moved up 0.5% on very low volume. This very low volume during a rally normally indicates that buying power is drying up and it seems that this interpretation is correct at this time, as its being seen after a few-week rally. It could be a sign that many will be exiting the market soon which will lead to lower prices.
We have seen no evidence of a strong bounce from the support line now in play. There was a rather weak attempt with insignificant success to move higher. Right after that gold price broke below the rising trend channel on strong volume, which a bearish indication. This tendency held on Monday, which means that we have most likely seen an end of the contra-trend rally. Please note that another move up on low volume would be a bearish signal, not a bullish one.
Consequently, the outlook overall is bearish for gold with numerous signs pointing to lower prices and few, if any which could be read as signs to the contrary.
Lets have a look at gold and silver mining stocks too.
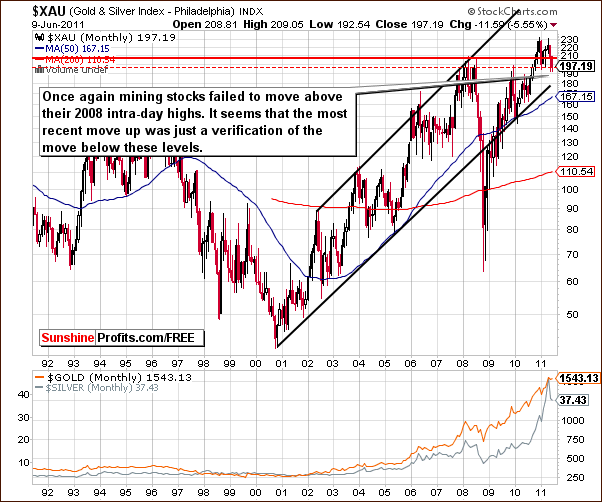
In the very long-term XAU gold and silver mining stocks index chart, we see a move below the level of the 2008 intra-day highs down to the level of monthly closing prices. It appears that the previous upswing was just a verification of the breakdown below the 2008 intra-day highs. Since May index levels have declined, moved back to the level of 2008 highs after having bottomed at highs based on monthly closing prices, and then declined again. In sum, it seems that the move below 2008 intra-day highs has just been confirmed, which is very bearish news for the whole sector.
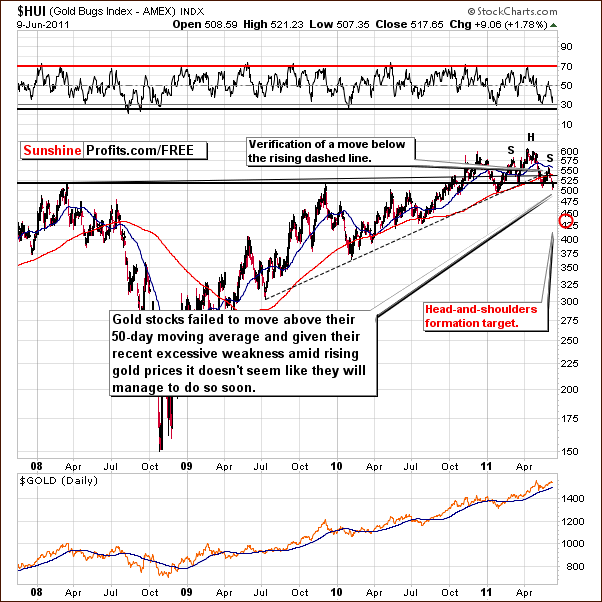
In HUI Index (gold stocks) chart, the signs are even more bearish. One of the key support level has been broken and the move has been verified. Namely, the rising dotted line in our chart provided support numerous times in the past but has been broken and this breakdown was verified as resistance several days ago.
Moreover, gold stocks appear to be completing the bearish head-and-shoulders pattern and if the index level moves below the level of previous lows, the completion of this pattern could lead to a considerable decline in the HUI Gold Bugs Index. It appears that the index could in fact move below the 450 level, which has not happened for nearly a year. Naturally, that would have profound negative effects for the underlying metals as well.
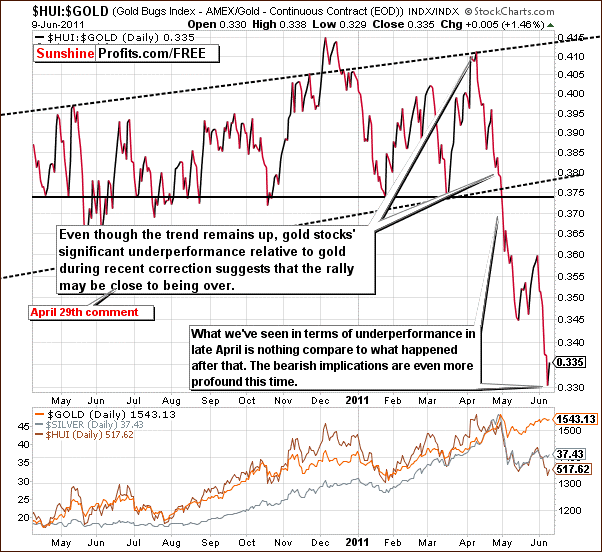
The above chart shows the ratio of gold stocks to gold itself. In our Gold Price Direction Based on Investors Sentiment essay, we discussed the underperformance of gold stocks and suggested that the rally was close to being over. At that time we stated the following:
We can clearly see the underperformance of golds stocks in recent days without using this ratio, but a look at the chart of the ratio shows that the gold mining stocks underperformance is significant. Investors with holdings in gold at this time should be concerned with its medium-term rally in light of the poor performance seen recently for gold mining stocks.
The patterns seen at that time were actually less profound than what we have seen since. This seems to infer that another move lower for precious metals is likely just around the corner.
Summing up, in our view, the technical analysis suggests a downturn in the precious metal sector. The situation for gold and silver mining stocks appears bearish overall as well as individually even without negative influences from the underlying metals. It seems that if the head-and-shoulders pattern is completed in the HUI Index (gold stocks) chart, the whole precious metals sector could decline significantly in the near-term.
To make sure that you are notified once the new features are implemented, and get immediate access to my free thoughts on the market, including information not available publicly, we urge you to sign up for our free e-mail list. Sign up for our gold & silver mailing list today and you'll also get free, 7-day access to the Premium Sections on my website, including valuable tools and charts dedicated to serious PM Investors and Speculators. It's free and you may unsubscribe at any time.
Thank you for reading. Have a great weekend and profitable week!
P. Radomski
--
The situation in the general stock market changed rapidly over the past week and the question now is if it does indeed have any implications on gold and silver. It certainly does but not necessarily on a day-to-day basis. The situation in USD and Euro Indices is also likely to affect prices of precious metals and this week's update includes our detailed explanations.
The latest report includes critical suggestions for both long-term Investors and short-term Speculators that are still up-to-date today. Additionally, we've included our comments on the most recent signal from one of our proprietary indicators and the top gold & silver junior rankings.
We encourage you to Subscribe to the Premium Service today and read the full version of this week's analysis right away.
