
This essay is based on the Premium Update posted on June 25th, 2010. Visit our archives for more gold articles.
In our most recent essay we have emphasized what influence might the general stock market have on the prices of the precious metals. Since the situation appears to be developing in the direction mentioned earlier and a part of the precious metals sector might be particularly affected in the near future, we would like to provide you with a follow-up.
We will start with the long-term SPY ETF chart (charts courtesy by http://stockcharts.com), which allows us to analyze volume.
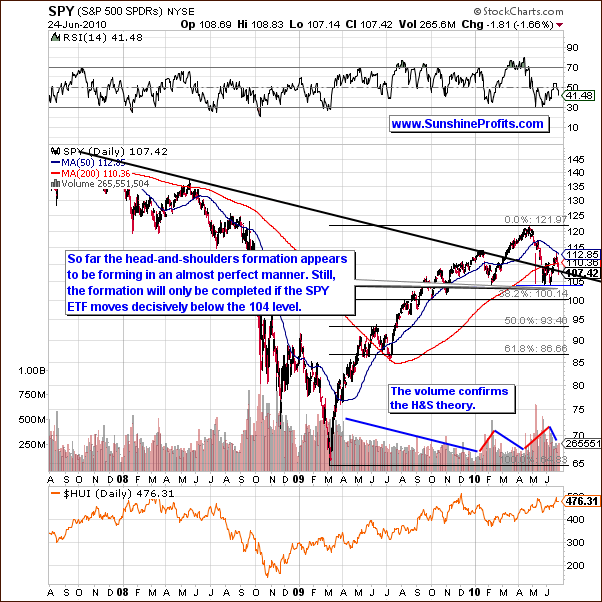
Last week, we devoted a great deal of the General Stock Market section in our Premium Update to the emerging head-and-shoulders pattern. Price and volume trends this week further confirm the likely full development of this very bearish pattern. We have seen declines in price along with increased volume levels. This will be more visible in the following part of this essay, where we study analyze short-term chart.
Note in the long-term chart, SPY ETF is close to the declining support level indicated by the black line above. It is possible that a slight upswing may be seen. This would not invalidate the emerging head and shoulders pattern unless a significant price increase was accompanied by high volume levels and if it took the value of the ETF above the $115 level. This is not expected to occur soon. It is much more probable that any upswing will be accompanied by low volume and thus short lived. The full development of the head-and-shoulders pattern continues to be quite probable. This spells trouble for stock prices in the following months.
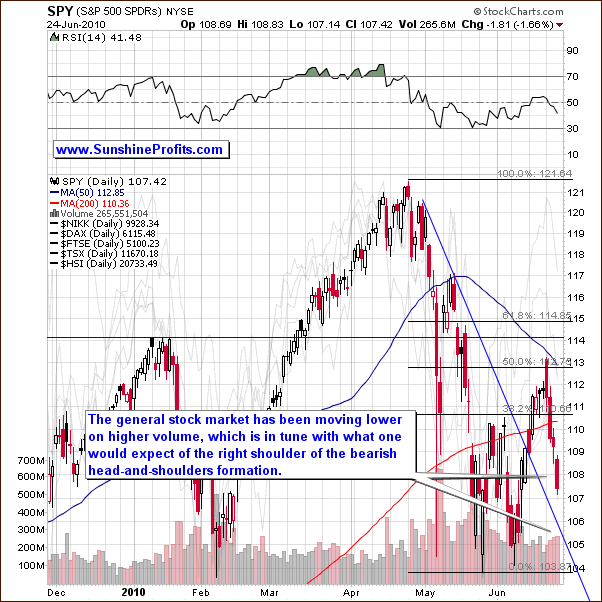
This week's short-term chart reveals that volume levels and declining prices have been far less dramatic than in prior weeks. We have seen sharp declines become the norm but it is important to remember that a daily or even weekly upswing would not invalidate the bearish outlook we have at present. Only a move to a level greater than 115 or so on high volume would accomplish this feat. We are far from this level today and see no signs of this as even a remote possibility in the near-term.
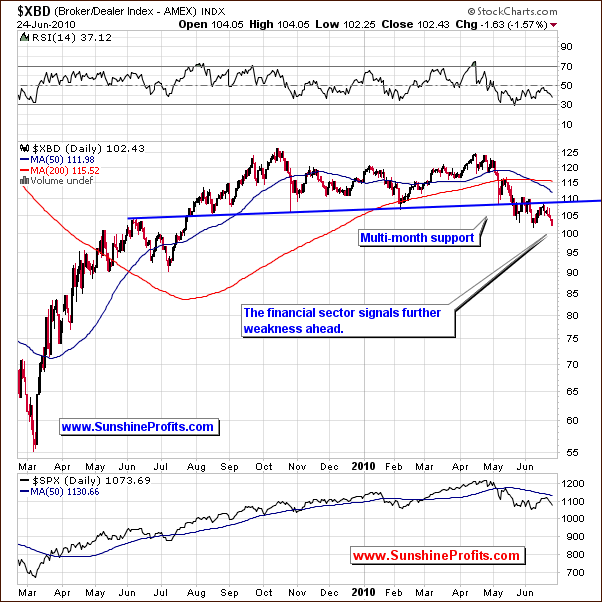
The Broker-Dealer Index, i.e. the financial sector this week confirms points we have made earlier. Note that the present level is close to previous lows. In fact, we are quite close to the lowest close since July, 2009.
It is important to note here that the financial sector often leads the other stock indices and the fact that we are presently at an 11-month low is quite important. Indications are that the general stock market will likely decline during the summer months reaching a probable bottom in the fall. History then supports a likely rally for much of 2011, a pre-election year for the U.S. President. This cycle of bullish markets has been in place for each pre-election year for nearly 80 years.
Therefore,the bearish sentiment professed last week has been further validated by the markets this week and we remain bearish for the medium-term. The possibility of temporary upward moves leads us to a neutral sentiment for the short-term (1-2 weeks). Historical trends have significant effects on market emotions, often overriding other underlying factors. Simply put, the strong patterns, which exist around and before U.S. Presidential election years cannot be ignored. At the same time, the head-and-shoulders formation could cause the main stock indices to move much lower during the summer months. In order to estimate decline's influence on gold, silver, and mining stocks, let's take a look at our correlation matrix.
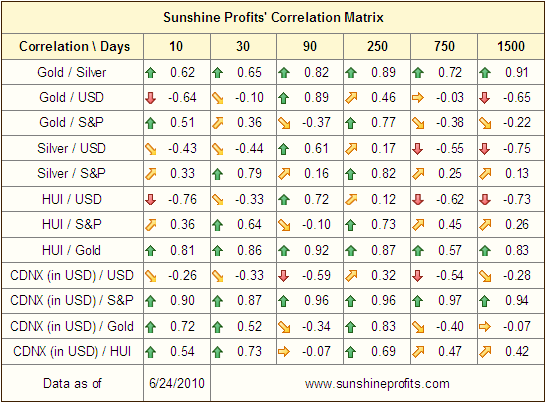
The correlation matrix is mainly used to seek information on how the major markets and indices impact the PM sector. We see very little change as compared to last week. However, several factors are worthy of note. Gold seems to be moving independently of the USD. Note the correlation coefficient is close to zero, that is, very low. This indicates near total independence as compared to the USD trends. The 30-day column does show a positive correlation in the range of 0.3- 0.4 but this is really not significantly high.
The main inference from this chart is that gold is less likely to be affected by weakness in the general stock market than silver and mining stocks. Note that their correlation (based on the last 30 trading days) hovers around 0.7. This is a strong correlation, which indicates likely movement in the same general direction. Finally, we see that juniors are also highly correlated with stocks, which is normally the case.
Consequently, given the current bearish situation on the general stock market gold itself appears to be the best option for the vast majority of Precious Metals Investors and Traders. This is consistent with what we have stated for several weeks. The risk/reward ratio has been and continues to be more favorable for gold.
It does not mean that silver nor mining stocks will not move higher along with gold - it means that the risk of them being negatively influenced by move lower in the main stock indices is higher than it is the case with gold. In other words, silver and mining stocks are not a bad long-term investment, but a more significant decline in these two sectors could occur if further downtrends continue in the general stock market. Simply put, gold is preferred in the short and medium-term. Silver and mining stocks continue to be quite risky for speculative capital at this time.
Let's take a closer look on gold chart itself for more details.
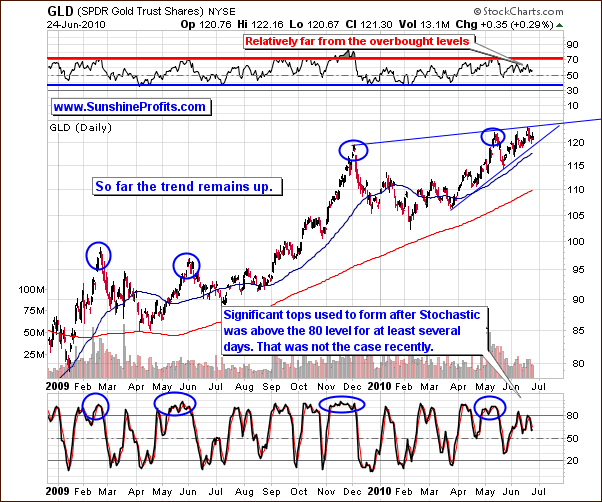
All in all, not much change was seen since last week. An appropriate motto could be much has happened but little has changed. Although the recent move down caused the gold market to decline, at this point the weekly chart suggests that this move was nothing more than just a verification of the previous breakout above the 2009 high. Consequently, the huge rally which gold has shown for the past four months may not be running out of steam yet.
The trend is still likely to be higher although we have seen increases followed by decreases throughout the past several days. Still, gold is within the rising trend channel, the RSI is slightly above middle range, and the stochastic indicator is below 80 (and it was not clearly above the 80 level, which was the case before previous tops were formed.) These indicators clearly show there is room for an additional rally. Any gains seen in the near-term, however, are likely to be less than spectacular, as at this point we don't see gold moving much higher (detailed projections are available to our Subscribers.)
Summing up, little changes of significance were seen in the markets this week (the general stock market being the only exception, as it continued to provide further bearish confirmations.) The frantic developments in Europe directly affecting the euro and the USD have somewhat calmed. Without any extreme headlines reverberating around the globe, the markets were generally quiet as seasonal factors were able to yield some guidance to market direction. As far as gold and silver are concerned, they are likely to move upwards and the risk-reward ratio of gold continues to be much preferred over that of silver and mining stocks.
To make sure that you are notified once the new features are implemented, and get immediate access to my free thoughts on the market, including information not available publicly, I urge you to sign up for my free e-mail list. Sign up today and you'll also get free, 7-day access to the Premium Sections on my website, including valuable tools and charts dedicated to serious PM Investors and Speculators. It's free and you may unsubscribe at any time.
Survey
Thank you for reading. Have a great weekend and profitable week!
P. Radomski
--
In this week's Premium Update we continue to provide you with details regarding the most probable short-term scenario for gold, silver, and mining stocks' prices, as well as provide our thoughts on what we expect in the next several months. In today's globalized economy no market moves on its own, so taking this into account we analyze markets that currently influence the precious metals sector, and explain which might become more important in the future.
This week's commentary includes 15 charts, including: Euro- and USD Indices, main stock indices, the financial sector, gold from various perspectives, silver (including white metal's cyclical turning points), HUI Index (what's a pre-spike and what does it mean to your portfolio?), GDX ETF. Additionally, we analyze the Gold Miners Bullish Percent Index. <p.moreover, we="" comment="" on="" china,="" and="" gold's="" popularity="" its="" short-,="" long-term="" <strong="">implications on the price of the yellow metal. We encourage you to Subscribe to the Premium Service today and read the full version of this week's analysis right away. </p.moreover,>
