
This essay is based on the Premium Update posted January 8th, 2009. Visit our archives for more gold articles.
During the past week we've sent a Market Alert to our Subscribers, in which we commented on the current developments on the precious metals market, and indicated what action appears to be profitable under those conditions, and in the following essay we would like to elaborate on one of the points raised in that particular message.
One of the factors that we mentioned was the USD Index, which was (and still is) very close to the cyclical turning point, as suggested by the previous analysis. Consequently, we believe it would be useful to comment on the performance of this important driver of gold and silver prices (charts courtesy of http://stockcharts.com)
Reviewing the big picture before digging into details is particularly useful when signals are mixed - which appears to be the situation today. Signals coming from the longer time-frames are generally stronger than those from daily charts, so beginning with these types of charts allows us to see what are the main, long-term tendencies and then look for confirmation (or lack thereof).
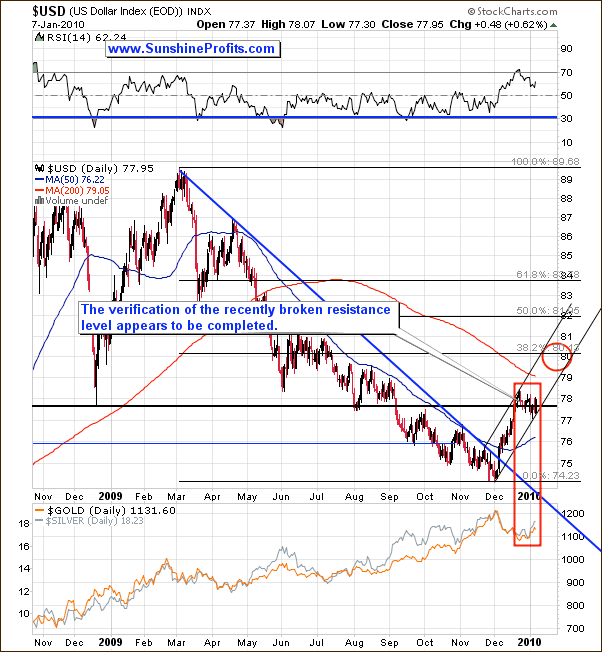
This time, this approach let's us put the current move down in the USD Index into proper context. The U.S. Dollar moved from below 75 to over 78 in just a few weeks, so a correction was likely (as we mentioned back then). Still, please keep in mind that the current upswing (since early December 2009) is itself a correction of much bigger (March 2009 - December 2009) decline that took USD Index from almost 90 to almost 74. This is a huge move that took most of the year to form, and 2-weeks of a rising prices are not very likely to fulfill the role of a correction.
In other words, it is doubtful that two weeks and correction of 27% or so of the size of the preceding move have already caused people to turn bullish / close out their short positions in the USD Index. The upswing was sharp, which makes me assume that many speculators perceive this phenomenon as very temporary (quick upswing followed by even quicker downswing). Consequently they have not closed their short positions yet, and once they do, USD Index is likely to move higher. As a digression - it is these types of psychological phenomena that make the whole chart analysis work.
Moreover, the current small (last few weeks) decline has been very calm compared to the previous upswing - which is exactly what consolidations look like. Additionally, the USD Index is correcting in the form of a flag, which is a typical formation of continuation (price is likely to move in the same direction as it did before it entered the formation).
The current correction caused the whole preceding rally to become less steep, which leads to the change in the time/price combination that is likely to contain the next local top. As usual, we've marked this area with red ellipse, and it is still around the 80 level, with the only difference being that it is now more likely to take place near the end of the month.
We've additionally marked the last few weeks with the red rectangle to emphasize the fact that recently PMs have been moving exactly in the opposite direction on the USD Index. Therefore, if the USD Index moves higher from here - possibly to the 80 area, gold and silver are likely to move lower at the same time.
Before summarizing, let's take a look at one of the ETF designed to track the performance of the U.S. Dollar - the Power Shares DB US Dollar Index Bullish Fund (UUP) - this will allow us to analyze volume.
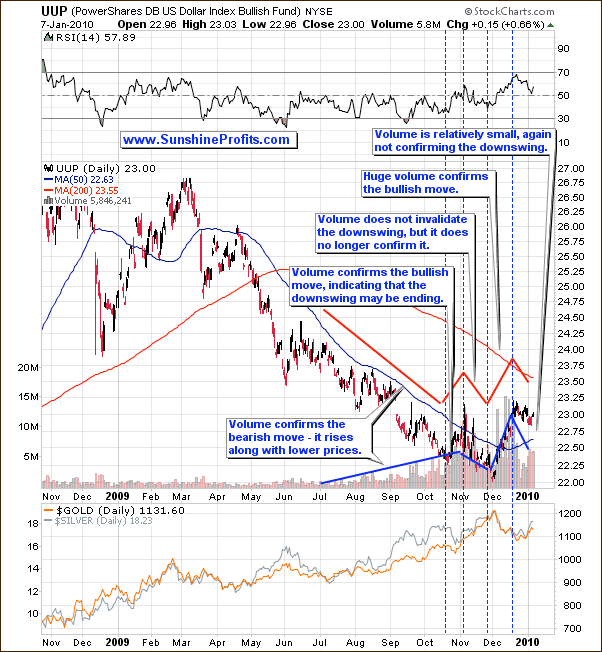
The red and blue lines on the chart above represent the direction in which the price and volume moved. Based on the changes in the direction we may recognize five time frames. The dashed vertical time lines mark the turning points in terms of price/volume behavior.
Before mid-October value of the USD Index declined along with rising volume, which means that people were more and more scared that the plunge would never end and sold more and more quantities of the currency. In mid-October situation changed as some investors jumped back on the long side of the market and many others followed. The move up took place on a very large volume indicating that this is not just a coincidence, and it signaled that a bigger move up might appear in the future. At the beginning of November, USD declined once again, but this time it moved lower on declining volume - which is normally neutral signal, but given the fact that the volume was rising during the previous part of the decline, it should make one at least suspicious.
Finally, early December was the time when the bottom was put and prices began to increase. The noteworthy fact is that it moved higher on an enormous volume, which means that this is not likely to be just a small blip on the radar screen. Since mid-December the value of the USD Index has been sliding lower, but this has been taking place on a small volume, which once again indicates that this is just a correction, and the next move in the USD Index will be up. The full version of this essay includes analysis the short-term USD chart, gold, silver, PM stocks, general stock market, rankings of top gold/silver juniors and much more.
Summing up, the USD Index has been moving lower in the past few weeks, but there are several points that suggest that this move is just a pause within a bigger move up. This means that gold's and silver's upswing may be postponed.
To make sure that you are notified once the new features (like the newly introduced Free Charts section) are implemented, and get immediate access to my free thoughts on the market, including information not available publicly, I urge you to sign up for my free e-mail list. Sign up today and you'll also get free, 7-day access to the Premium Sections on my website, including valuable tools and charts dedicated to serious PM Investors and Speculators. It's free and you may unsubscribe at any time.
Thank you for reading. Have a great and profitable week!
P. Radomski
--
In this week's Premium Update we further elaborate on the situation on the gold and silver markets, with the emphasis on its current connection with the U.S. Dollar. The USD Index is currently one of the most important things to take into account while analyzing gold and silver market, and this update includes its detailed analysis (3 charts are dedicated to this key driver of PM prices).
Other things analyzed in this week's Update include: cyclical tendencies on the silver market, PM stocks, the relative performance of the latter to other stocks, the general stock market itself, and our exclusive correlations matrix.
In addition to the above, we feature rankings of top gold and silver juniors. Two gol.
We encourage you to Subscribe to the Premium Service today and read the full version of this week's analysis right away.
