
This essay is based on the Premium Update posted on February 26th, 2010. Visit our archives for more silver articles.
This week the World Gold Council released their 2009 Gold Demand Trends report and embedded in the statistics were a few tidbits we found interesting.
Overall investment in gold was 7% higher in 2009 than 2008. This is significant when you take into account that demand in the fourth quarter of 2008, during one of the worst financial meltdowns we have ever known, was so great that there were global shortages of physical metal. Nevertheless, in 2009, at a time when fears of a global financial disaster have abated somewhat, investors still bought more gold than in 2008. In other words, more gold was purchased at higher prices when the markets were less terrifying, than when the prices were lower and fear was at its zenith.
China was the only non-western country to record positive growth in net retail investment during 2009. ETF demand in 2009 was 85% higher than the previous year, while bar hoarding, largely from the non-western markets, experienced a significant decline.
The Gold council believes that regardless of whether the economic recovery gathers steam or stumbles, western investment demand will remain "well supported." If the global economy falters, investors will flock to gold. Conversely, if the recovery gathers momentum, inflation will come into play, and with it a rising gold prices.
So which will it be? Will the economic recovery gather momentum or will it stumble? We don't need a peak at the 2010 Gold Council report, which will come out a year from today, to know that the trajectory for gold prices is up.
For one thing, western governments have not stopped the fiat currencies printing presses from working 24/7.
We've recently read something (http://www.lewrockwell.com/margolis/margolis179.html) that can elucidate the enormous, almost incomprehensible, size of the U.S. government debt. The numbers are so huge that it is difficult for most people to get a handle them.
If you had spend $1 million each day from the time of the establishment of the ancient city of Rome-about 2,700 years ago-until today, you would have accumulated about $1 trillion in debt. But hold on. You would have to double that figure to get to the $2 trillion in foreign debt that must be repaid or refinanced each year by the U.S. government, a feat accomplished in only a few short years.
It doesn't take a genius in economics to understand that when you print ever-increasing supply of fiat currency, it will inevitably lose its value. If so, where will people turn for safety? Gold and silver, and it is the latter that we would like to describe more deeply in the following part of this essay.
Let's begin with the long-term chart (charts courtesy of http://stockcharts.com.)
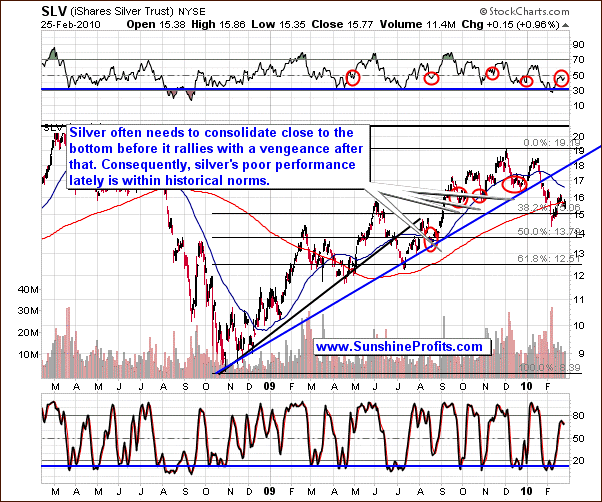
Points made in the previous Premium Update regarding the long-term situation on the silver market are up-to-date also today.
(...) the RSI and Stochastic indicators suggest that the price of silver is likely to reverse soon, but these indicators are based on price alone - they don't take the volume factor into account." This is relevant also today, as the volume during the upswing that we've seen in the past few days, is not really impressive.
(...) it may seem strange that silver (the SLV ETF) is currently hovering around $15 instead of rallying strongly. However, taking a second look at the above chart reveals that this is the way that silver used to behave shortly after it had bottomed. We've marked these situations with red ellipses. Please note that if that pattern is to repeat itself once again, silver may move much higher soon.
This is the case also today, as the SLV ETF around $16 is not really much higher than it was when the latest bottom was formed and the volume during upswings is relatively low. Instead of rallying, silver is more or less trading sideways and moving insignificantly higher. Still this is a normal behavior for silver during the bottoming process, and it confirms that the last chance to get back on the long side of the market is not behind us.
The Stochastic indicator has formed a double bottom, which in the past signaled that the bottom is in. But let's not forget that it moved very briefly lower at the end of December 2009, when silver declined as well - back then it meant the final downswing before the $1+ rally.
Please note that the RSI indicator is slightly below the 50 level, just like it was the case in the past at the end of the consolidation / beginning of a rally.
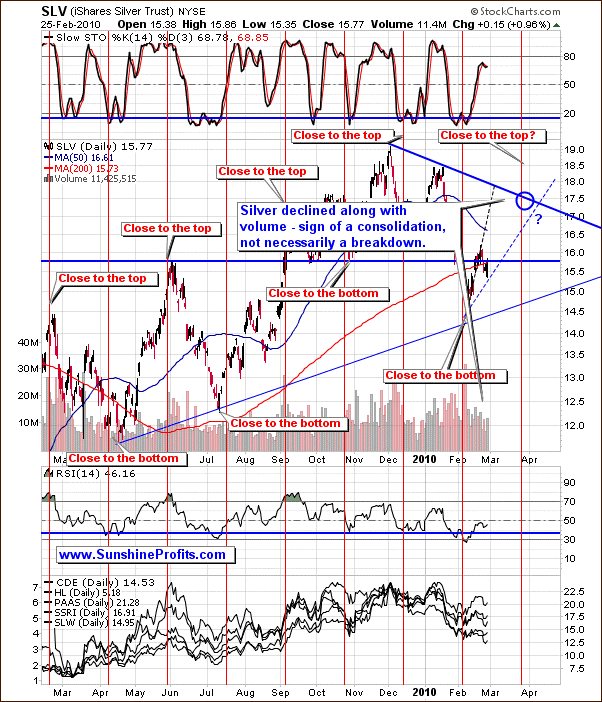
In the previous Premium Update we wrote that at least a brief correction is likely.
Please take a look at the April 2009, July 2009, and November 2009 bottoms - once the bottom was put in around the date suggested by the red vertical line (as was the case recently), in silver corrected at least briefly before rallying significantly. Should that be the case also today, one might expect silver to move lower relatively soon.
Additionally, please take a look at the pace of growth of the price of silver since its early-February bottom. Should it be sustained it would move to the next strong resistance level very quickly and put in a temporary top much before the cyclical tendencies suggest.
Of course, it is possible that the resistance level marked with the blue declining line doesn't hold silver and it will move much higher without stopping at $17.5 - $18, however we don't find that outcome very likely. Instead, we see silver consolidating at least for a while, and reaching a temporary top within a month or so.
This is what we've seen this week. Silver corrected briefly and is currently once again over the $16 level. If silver does indeed rally from here (as we expect it to), the lower rising dashed line will become a short-term support level. Target prices for silver, gold, and PM stocks are included in the full version of this essay (we've set a record - it has 20 charts/tables each with detailed description) available to our Subscribers.
Summing up, silver appears to have formed a minor bottom and is ready to move higher rather sooner than later. Naturally, that is the case if the general stock market doesn't plunge and drag PMs with it. We are still waiting for the confirmation that PM stocks can rise on their own, instead of being lifted along with other stocks. Until that happens we must remain cautious. As always, we will keep our Subscribers updated.
To make sure that you are notified once the new features are implemented, and get immediate access to my free thoughts on the market, including information not available publicly, I urge you to sign up for my free e-mail list. Sign up today and you'll also get free, 7-day access to the Premium Sections on my website, including valuable tools and charts dedicated to serious PM Investors and Speculators. It's free and you may unsubscribe at any time.
Thank you for reading. Have a great weekend and profitable week!
P. Radomski
--
The precious metals market appears to have formed a minor bottom and is ready to move higher. At this moment, in our view, almost all charts point to higher prices of PMs and the only piece of the puzzle that's not fitting is the situation on the general stock market. The problem is that it's currently one of the most things that we must take into account.
This week's Premium Update is the biggest one that we've ever created in terms of charts/tables - there is 20 of them, each with detailed description. Not only to we provide you with the analysis of cycles in silver and the U.S. Dollar along with fractal (self-similar) patterns on the gold market (long- and short-term perspective), but we also check which of the popular analytical tools might be misleading at the moment.
Naturally, as mentioned in today's Market Alert, we provide you with the target areas for the current rally.
Additional things covered this week include: USD Index (also in the form that allows us to analyze volume), main stock indices, and our correlation matrix. We also analyze the performance of gold in various currencies: Euro, Yen, British Pound, Canadian Dollar, and Australian Dollar. We encourage you to Subscribe to the Premium Service today and read the full version of this week's analysis right away.
Back