
Based on the November 5th, 2013 Oil Investment Update
The first days of the new month have been hard for oil bulls. After the breakdown below the lower border of the declining trend channel the buyers didn't manage to stop oil bears. The bears showed their claws on Thursday and pushed the price below the October low. This event resulted in a heavy decline, which took light crude below $95. On top of that, yesterday we saw further deterioration and crude oil dropped to a new monthly low of $94.06.
The selloff in crude oil has been fueled by rising U.S. stockpiles, which have climbed roughly 8% over the past six weeks as refiners have curbed their crude processing amid seasonal maintenance work and waning gasoline demand. Last Wednesday, the U.S. Energy Information Administration said crude inventories rose by another 4.1 million barrels in the week ended Oct. 25. Total inventories now stand at 383.9 million barrels and government data this week could show that stockpiles finished October at their highest level since 1930.
Taking the above into account, we can conclude that crude oil has traded lower as traders view the market as adequately supplied. Even output declines in OPEC member Libya, home to Africa's largest oil reserves, have not contributed much upside to oil prices.
Yesterday, light crude extended losses as ongoing concerns over rising U.S. inventories and weaker demand in the world's largest oil consumer drove prices lower. In this way, the price dropped to a new four-month low of $94.06. Taking this fact into account, investors are probably wondering where the final bottom of the current correction is.
In today's essay we take a closer look at the chart of crude oil from the medium term perspective to see if there's anything on the horizon that could drive the price of light crude higher (charts courtesy by http://stockcharts.com).
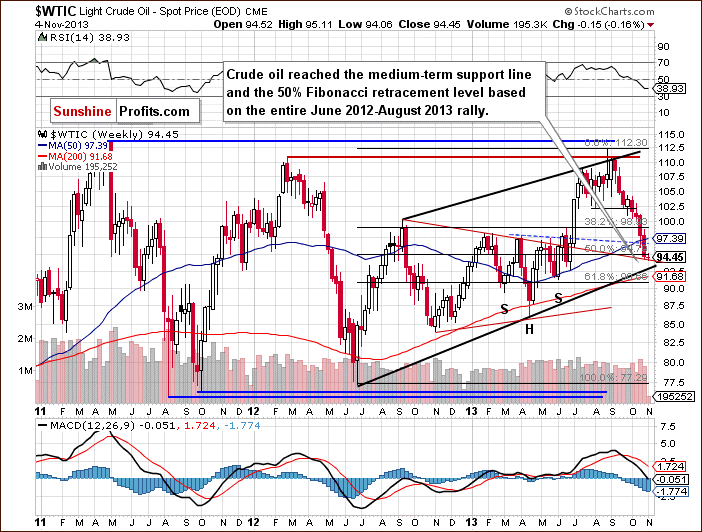
Looking at the above chart, we see that the price of crude oil declined once again in the previous week and dropped below $95. Yesterday, we saw further deterioration and light crude hit a new monthly low of $94.06. In this way crude oil slipped below the 50% Fibonacci retracement level based on the entire June 2012-August 2013 rally. However, the breakdown is not confirmed at the moment. With this downward move the price reached the medium-term support line based on the September 2012 and January 2013 highs. If this support line encourages oil bulls to act, we may see a pullback in the near future. On the other hand, if they fail and crude oil declines once again, the next target for the sellers will be the medium-term rising support line based on the June 2012 and April 2013 lows (currently around $93 per barrel). From this perspective further decline seems limited.
Having discussed the medium-term outlook for crude oil and oil stocks, let's move on to the oil to oil stocks ratio. Is it possible that will give us some interesting clues?
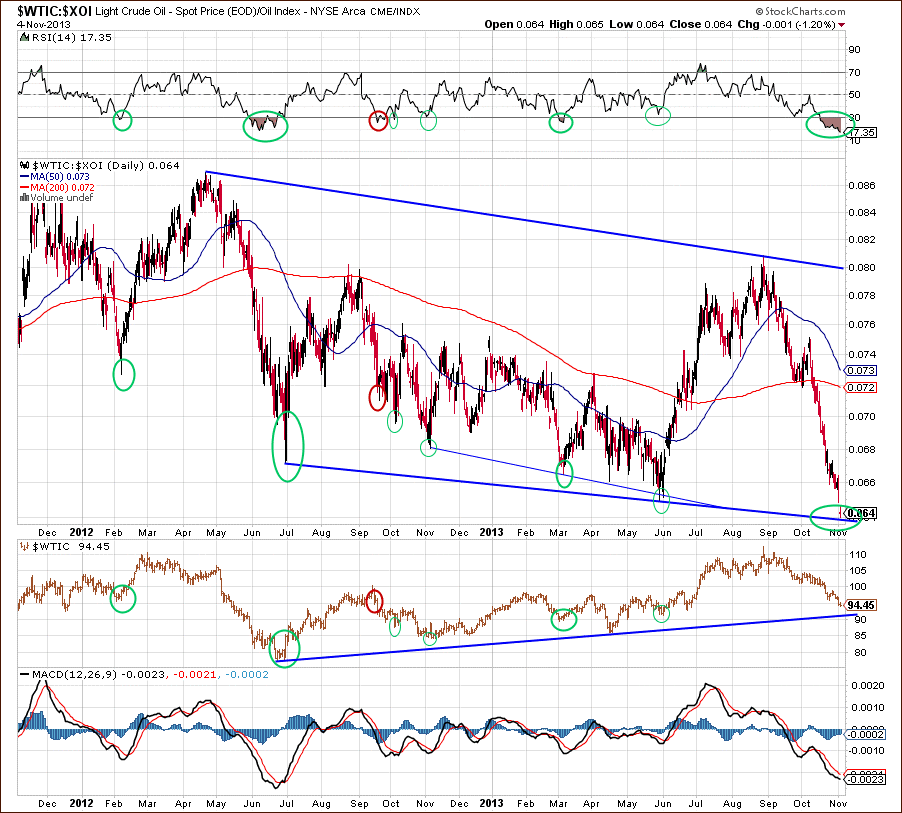
Looking at the above chart, we clearly see that from the end of August the ratio has declined and reached the long-term support line in the recent days. Additionally, the RSI dropped to its lowest level since June 2012 and now it's extremely oversold.
Back then, such a low value of the indicator had a positive impact on light crude. After the RSI moved below the 30 level, we saw a pullback in the ratio in the following days. What's interesting, this increase coincided with higher prices of light crude.
When we take a closer look at the above chart, we clearly see that there have been many similar situations in the past. In October 2012 and then in November a pullback in the ratio triggered a pullback in crude oil. Earlier this year, we saw such price action too. In March, when the RSI dropped below the 30 level and then moved higher, we also saw increases in the ratio and in crude oil.
In June, the ratio dropped below the short-term declining support line based on the November 2012 and March 2013 lows, but this deterioration was only temporary. In the following days, we noticed a sharp pullback, which pushed higher not only the ratio, but also light crude. Back then, it resulted in the June-August rally.
As mentioned earlier, in the recent days, the ratio has dropped to the long-term support line, which is an important support level. Taking into account the price action that we've seen in the past, it seems that a bigger pullback in crude oil is just around the corner. If history repeats itself once again, higher levels of the ratio will likely trigger a pullback in crude oil in the following days as well.
Summing up, although the situation is bearish from the medium-term point of view, light crude almost reached the medium-term support line, which may trigger a bigger pullback. Additionally, the oil to oil stocks ratio is at an extreme low, as indicated by the RSI. This could very well result in the end of the underperformance and strong performance of crude oil.
If you'd like to stay up-to-date with our latest free commentaries regarding gold, silver, crude oil and related markets, please sign up for our free mailing list today.
Please note that at this time we still have a promotional offer that allows you to subscribe to my Oil Investment Updates and Oil Trading Alerts for only $1 and $2, respectively, for the first 3 weeks of service. I encourage you to subscribe today.
Thank you.
Nadia Simmons
Sunshine Profits' Crude Oil Expert
Oil Investment Updates
Oil Trading Alerts
