
This essay is based on the Premium Update posted on March 12th, 2010. Visit our archives for more gold articles.
In our previous essay we mentioned that although it was not clearly visible in the past weeks, looking at the charts with the RSI and stochastic readings in mind, silver's historical cyclical tendencies point to a downturn. This decline could be easily triggered by a downturn on the general stock market.
However, the main stock indices did not move lower recently - instead they moved above their January 2010 high. Please note that the breakout has not been confirmed by all indices, so the risk of a downturn is still not low at this point.
Given the high correlation between stocks and the PM sector, this is generally a bullish factor, but caution is necessary in the short run - especially given the high level of similarity between the situation in the gold market in August 2009 and the one that we have today. Let's take a look at the long-term chart (charts courtesy of http://stockcharts.com) for details.
In the previous Premium Update we wrote the following:
(...) the situation on the gold market is still self-similar also in the short run. It appears that the RSI Indicator moved has formed a high around the 60 level, just like it was the case in early August 2009, after which gold prices moved lower for about 2 weeks. Since the current move is still very similar to what we've seen in the middle of 2009, we might see some kind of consolidation here - perhaps 2-3 weeks of lower prices.
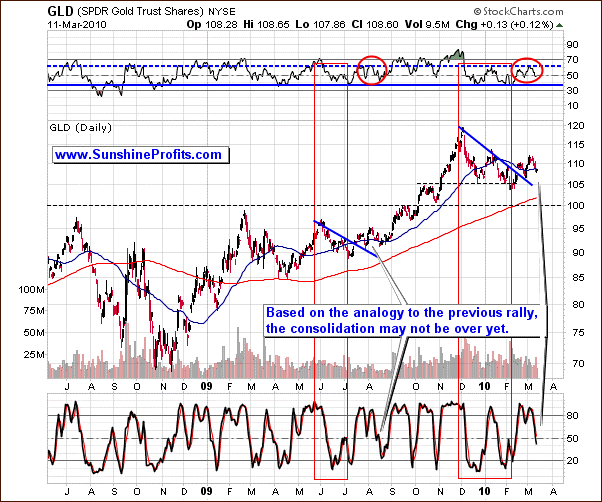
This is precisely what we've seen this week - gold moved lower along with the RSI and Stochastic indicators. Please note that we've mentioned 2-3 weeks of consolidation and so far we've seen only one week of the corrective action, which suggests that caution is still necessary. The bullish analogy is that when the previous correction (August 2009) was completed, gold surged very high. Still - as mentioned earlier - much depends on the general stock market.
The short-term chart provides us with details:
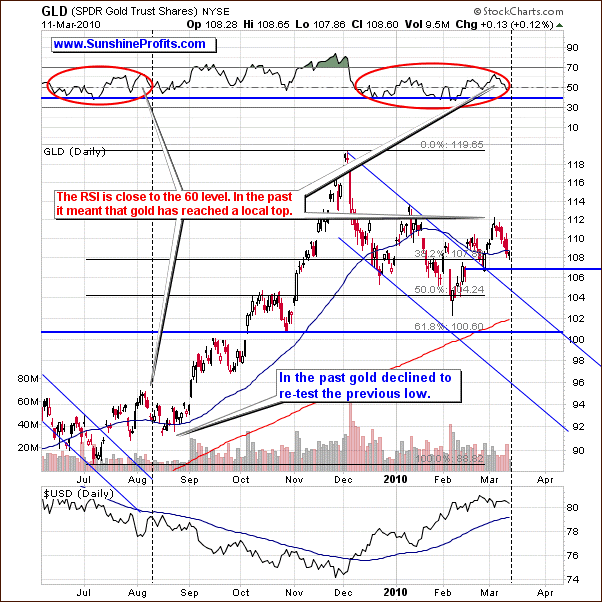
The red ellipses on the long- and short-term charts mark the self-similarity on the gold market, and the vertical dashed line shows where "we are today" if the situation is to repeat itself so closely as it was the case in the past several days. Please note that the analogy does not only cover the price itself, but it is also present in the RSI indicator, and - what is very interesting - gold's performance relative to the U.S. Dollar (as seen on the last chart.) It currently suggests that the recent small rally was just a pause within the 2-3 week correction, and thus another small move lower is to be expected.
Please note that during the first half of August 2009, gold declined along with the U.S. Dollar, however once the negative correlation returned - in the second half of August - it was a sign that "something is in the works." Soon after that we got a confirmation in the form of a big rally on strong volume, and the massive upleg begun. Taking the historical performance into account, once we see that the negative correlation between gold and the USD Index has returned we might consider it as a "get-ready-to-buy" signal.
Speaking of the U.S. Dollar, let's take a look on the price of gold from the non-USD perspective. UDN is the symbol for PowerShares DB US Dollar Index Bearish Fund, which moves in the exact opposite direction to the USD Index. Since the USD Index is a weighted average of dollar's currency exchange rates with world's most important currencies, the gold: UDN ratio means the value of gold priced in "other currencies."
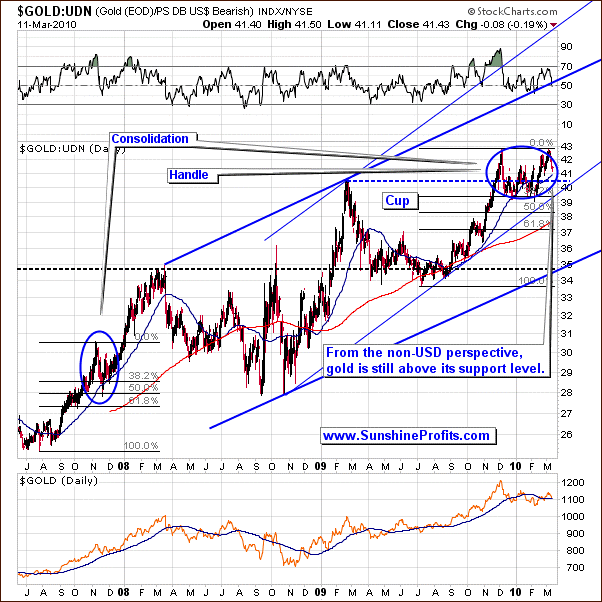
The above chart is generally bullish in the long-term, as the trend remains up, but it does not provide us with a specific trading signal at this point. Still, it shows that the price of gold is not at a support level at this point. This means that a move lower from here is possible.
Summing up, based on how gold prices have behaved, as measured by the Gold ETF (GLD), it points to a further pullback after which PMs are likely to rally strongly. During the similar situation in the past the stochastic, RSI and price were all aligned this way the prices retreated back to make another short-term bottom before returning back to its uptrend. Still, much depends on how the situation resolves on the general stock market. We will continue to monitor the situation and report to our Subscribers you as soon as we spot anything that would invalidate points made above.
To make sure that you are notified once the new features are implemented, and get immediate access to my free thoughts on the market, including information not available publicly, I urge you to sign up for my free e-mail list. Sign up today and you'll also get free, 7-day access to the Premium Sections on my website, including valuable tools and charts dedicated to serious PM Investors and Speculators. It's free and you may unsubscribe at any time.
Thank you for reading. Have a great and profitable week!
P. Radomski
--
When politicians talk it is always a good idea to try and read between the lines. Therefore, in the first part of this week's Premium Update we comment on the recent gold-related statement made by China's chief foreign exchange regulator, Yi Gang.
In the previous Premium Update we've summarized that keeping an open speculative long position in the PM sector does not seem profitable from the risk/reward perspective and precious metals have been correcting since that time. This week we provide you with a follow-up on this analysis and let you know what we think might be waiting just around the corner. The self-similarity present on the gold market provides us with valuable insight as far as the shape of the current correction is concerned, while the cyclical tendencies on the silver market and the U.S. Dollar market provide us with timing details.
This week's issue includes our comments on the USD index (including the analysis of volume) , general stock market, gold, silver, and precious metals stocks - all of which we've covered from both long- and short-term point of view. Moreover, we mention the recent signal on the chart of Gold Miners Bullish Percent Index.
Additionally, we comment on the very-long-term tendencies present on the silver market, and what one might expect in 2011. We encourage you to Subscribe to the Premium Service today and read the full version of this week's analysis right away.
