
Based on the November 15th, 2013 Premium Update. Visit our archives for more gold articles.
In our most recent article on gold, USD and Euro Indices we wrote that the outlook for the yellow metal was bearish just as the outlook for the Euro Index and just as it was bullish for the USD Index. At this time – since all of the above-mentioned markets moved in the opposite way – you might be wondering if we are sticking to the above analysis. In the medium-term, we do, but not in the short run. In fact, earlier this week we told our subscribers to cash in the profits from the short positions as the bullish correction was quite likely to be seen.
So, have metals bottomed? Not necessarily. Let’s take a look at the following charts and discuss them. After we describe them, you’ll see, why it’s not a sure bet (charts courtesy of http://stockcharts.com.) We’ll start with the USD Index.
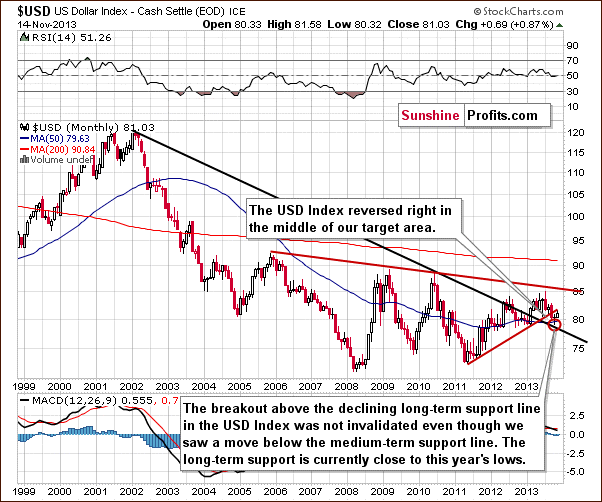
The situation in the long-term chart hasn’t changed much recently and what we wrote in our last article is still up-to-date today.
(...) the long-term breakout above the declining long-term support line was not invalidated. Additionally, the USD Index reversed right in the middle of our target area. Therefore, from this perspective, it seems that the downward move – if it’s not already over – will be quite limited because the long-term support line will likely stop any further declines.
Now, let’s examine the weekly chart.
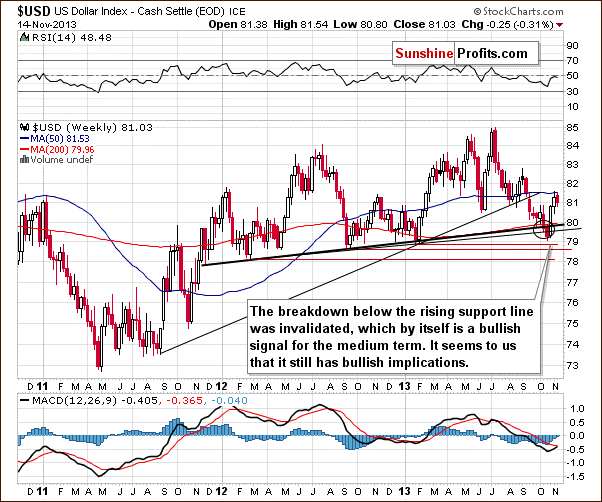
Looking at the above chart we see that after a sharp rally, which invalidated the move below the lower support line and the breakdown below the medium-term support line (a bold black line), the USD Index almost reached the previously-broken rising medium-term support line created by the August 2011 and January 2013 lows.
The invalidation of the breakdown is itself a bullish signal and it seems that we will still see more of its impact in the coming weeks.
Although we saw a correction in recent days, it is still shallow, which is a bullish signal for the short term – every now and then markets need to take a break from rallying – none of them can move in one direction all the time.
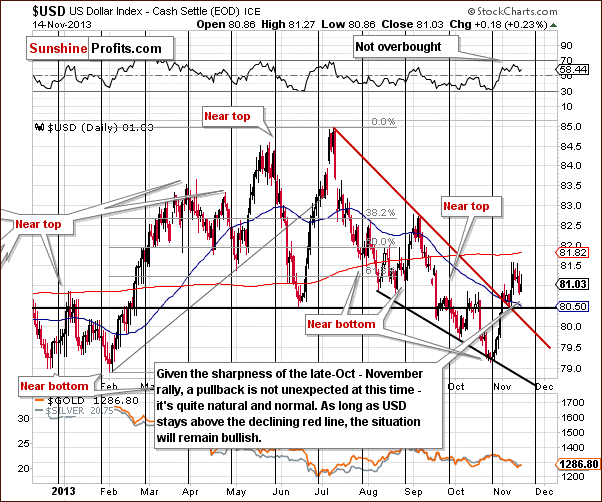
Let’s check the short-term outlook.
Quoting our previous article:
(…) the USD Index rallied in the previous week and moved above the previously-broken resistance line based on the June low. Additionally, (…) the U.S. dollar broke above the short-term resistance line based on the July and September highs. Looking at the above chart we see that both breakouts were confirmed.
On the above chart we clearly see that after the sharp late-October-November rally, the USD Index gave up some of the gains and corrected earlier growth in recent days. Despite this drop, the U.S. dollar still remains above the previously-broken resistance lines. Please note that as long as it stays above the short-term resistance line (marked with red), the situation will remain bullish.
Let’s now take a look at the Euro Index.
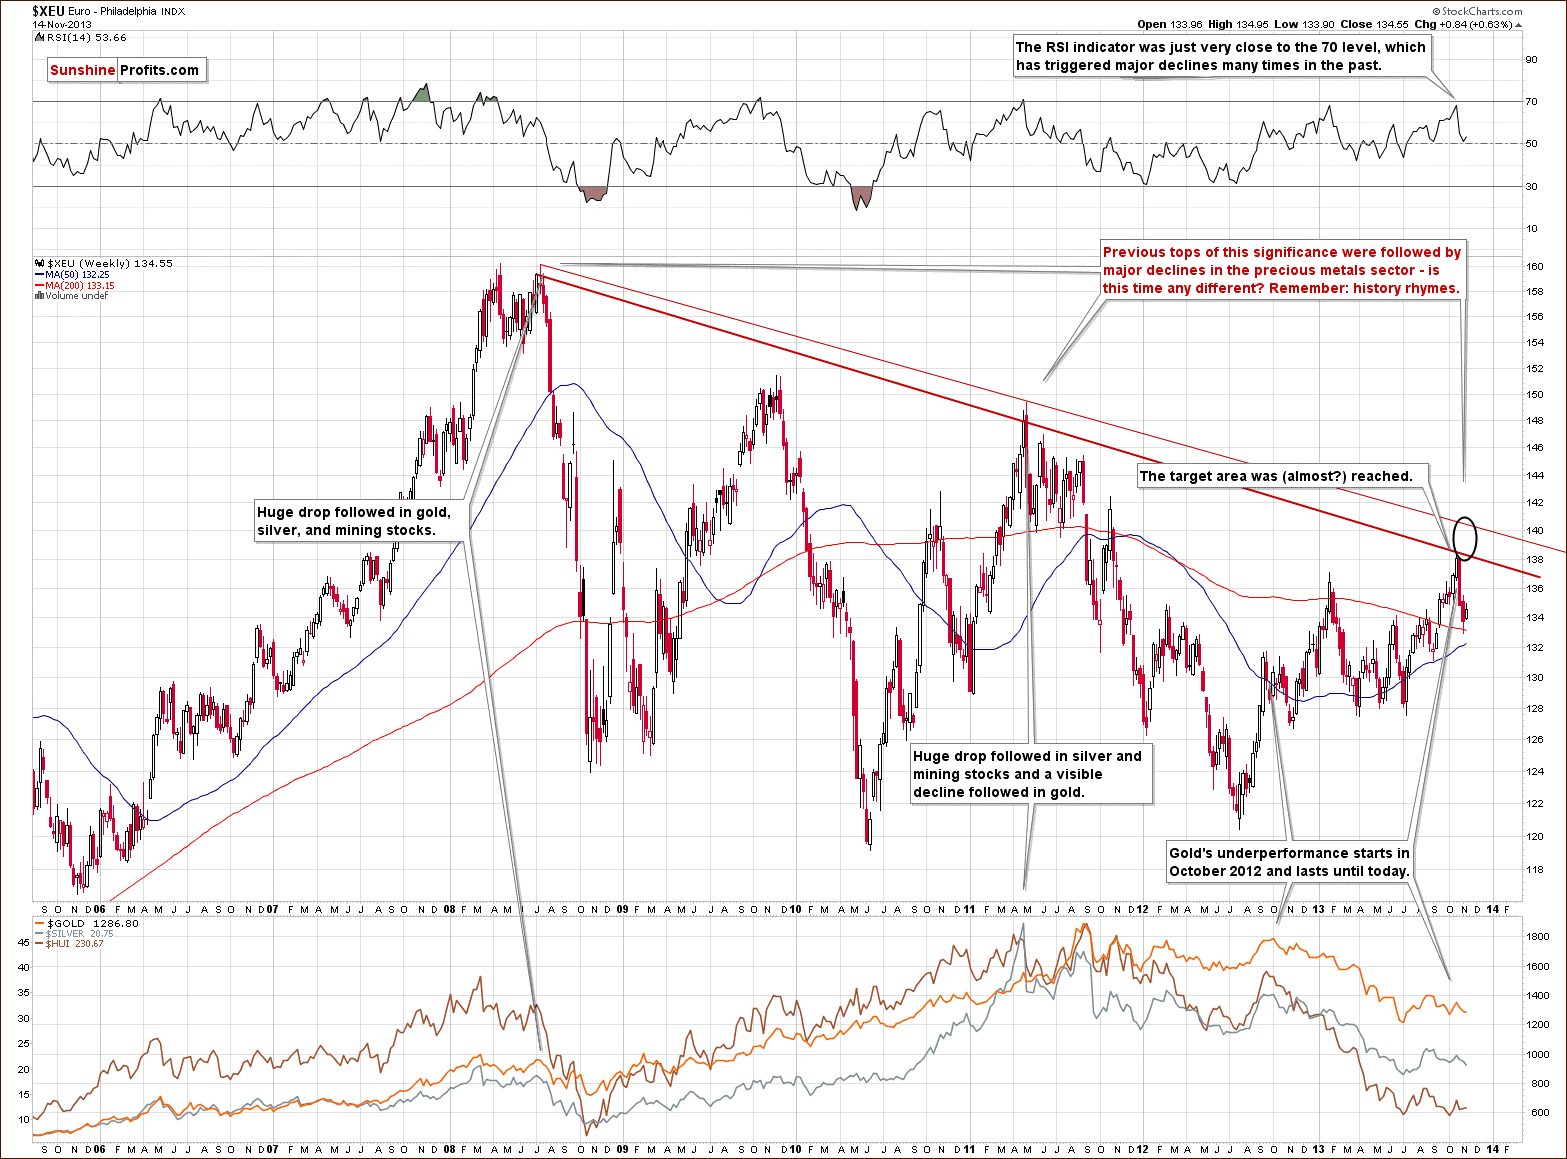
Looking at the above chart we see that the October - November decline pushed the European currency to its lowest level since mid-September. At the beginning of the week the Euro Index bounced off the last week’s low and continued its upward move in the following days. In this way, the European currency almost reached the previously-broken 135 level. In spite of this fact, this week’s upswing didn’t change anything, because it didn’t even erase half of the recent decline. Taking this fact into account, it seems that further deterioration is quite likely in the coming week.
To see the current situation more clearly, let’s zoom in on our picture and move on to the medium-term chart.
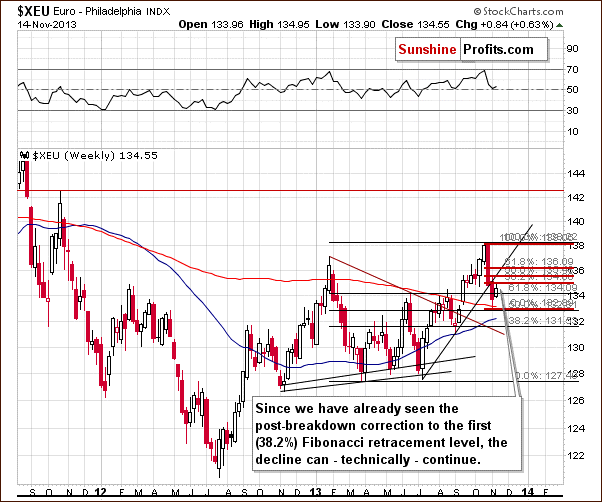
From the medium-term point of view, the situation is a mirror image of what we saw on the short-term USD Index chart. After the Euro Index dropped below its rising support line and erased 50% of its entire July – October rally, we saw a relatively small move back up, which took the European currency to the 38.2% Fibonacci retracement level based on the October - November decline.
As mentioned earlier, although we’ve seen some improvement in the recent days, the Euro Index still remains below the level of 135. Additionally, the breakdown below the rising support line hasn’t been invalidated.
Please note that the current correction is still shallow, which means that the decline can continue. Even, if we see a move higher, to the 61.8% retracement level, the euro will still remain in a downtrend. From this point of view, the situation is bearish. But if we see a move below 131.56 the bearish implications will be even stronger. On a very short-term basis, though, we can’t rule out more strength in the European currency.
All in all, we could see further improvement in the Euro Index and weakness in the USD Index on a short-term basis. However, it seems that the bearish trend will remain in place as long as the euro remains below its short-term resistance line and the dollar stays above its short-term support line. Therefore, currently, the implications for the precious metal market are bullish but are likely to become bearish shortly. Please take a look at our Correlation Matrix for the confirmation of the above.
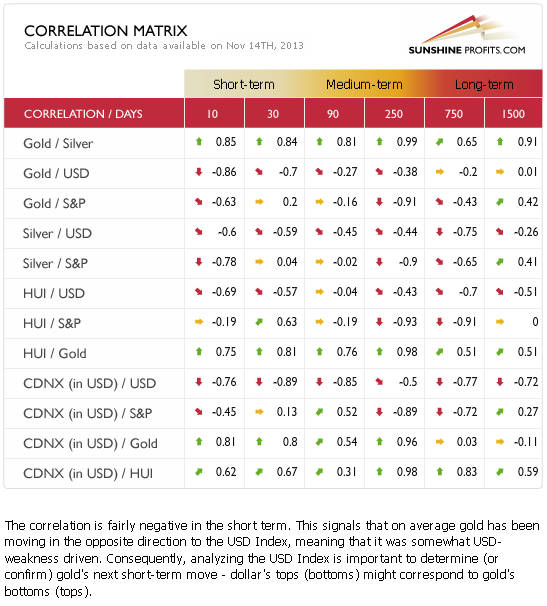
Correlations seem to have moved back to their default values in the case of the USD Index and the precious metals sector. This means that it's no wonder that metals and miners are correcting – the reason could simply be the correction in the USD Index. The latter had quite a volatile run up in the recent weeks and – as mentioned earlier in today's update – was something that one could have expected. Just as the trend remains up in case of the USD Index, the trend remains down in case of the precious metals sector.
Meanwhile, the correlation coefficients between PMs and the general stock market are rather insignificant on a short-term basis (with the exception of the mining stocks sector, which seems to be waiting for a decline in stocks in order to decline itself), so we can't tell much about the possible impact of the current outlook for stocks for the prices of gold and silver.
Overall, with bullish implications from the currency sector (despite a very short-term correction that was likely triggered by the correction in currencies) and the unclear impact of the stock market, the precious metals sector seems to be set to decline once again after a quick move up.
What about gold itself? Let’s take a look.
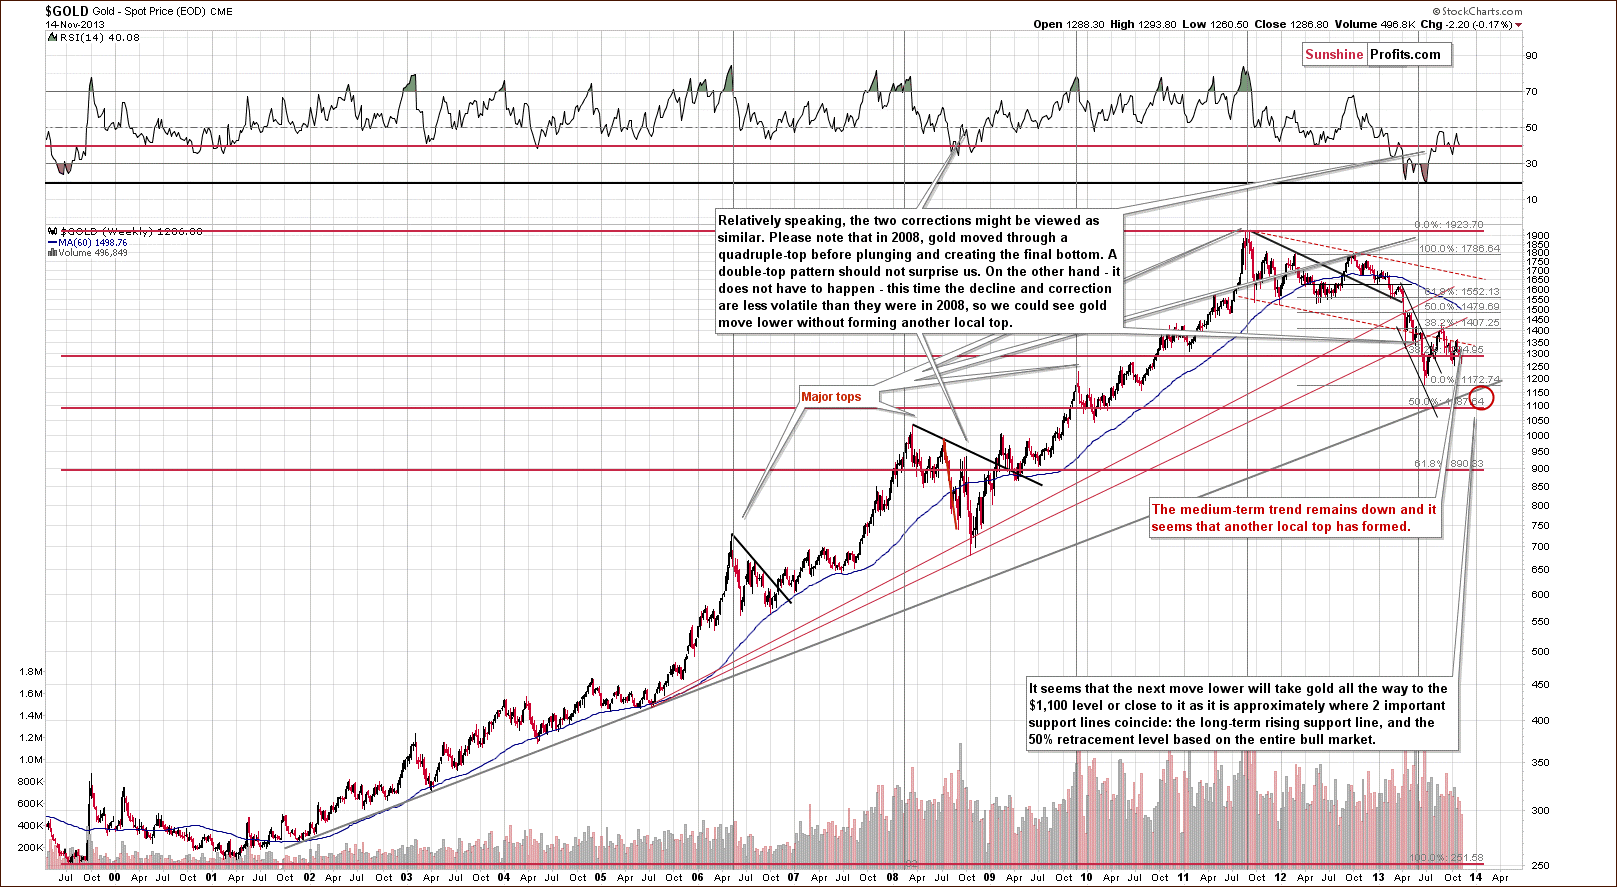
Quoting our previous Premium Update:
Looking at the above chart we see that the situation hasn’t changed much from the long-term perspective. The medium-term outlook was bearish as gold had already broken below the long-term rising support line and the recent decline naturally hasn’t made the situation look bullish.
The medium-term trend remains down and from this perspective it seems that another local top has formed. Therefore, further deterioration is quite likely, if not immediately, then at least soon.
Gold is trading very close to the 38.2% Fibonacci retracement level ($1,285) based on the entire bull market, and just a bit more weakness might trigger a significant sell-off if the breakdown is confirmed.
Summing up, while gold could move higher in the following days – triggered by strength in the Euro Index and weakness in the USD Index – it will likely be just a counter trend move that will be followed by further declines.
Thank you for reading. Have a great weekend and profitable week!
Przemyslaw Radomski, CFA
PS. Please keep in mind that the situation on the precious metals market may change quickly and what you read above may become outdated before you read our next free essay. That's why our premium subscribers receive Market Alerts as soon as anything important takes place - they remain covered at all times. Moreover, our subscribers read full versions of our articles that we call Premium Updates - they are much more in-depth and thorough than free commentaries posted in this section, so by reading them you are better and earlier prepared when major changes regarding gold and silver occur. Premium Updates include price targets and trading suggestions as well. Our subscribers also enjoy up-to-date and tailor-made (!) gold stocks ranking, silver stock ranking and more. We encourage you to join our subscribers and also enjoy all of the above-mentioned benefits.
Back