

Stock Trading Alert originally sent to subscribers on March 16, 2015, 7:16 AM.
Briefly: In our opinion, speculative short positions are favored (with stop-loss at 2,090 and profit target at 1,980, S&P 500 index)
Our intraday outlook is bearish, and our short-term outlook is bearish:
Intraday outlook (next 24 hours): bearish
Short-term outlook (next 1-2 weeks): bearish
Medium-term outlook (next 1-3 months): neutral
Long-term outlook (next year): bullish
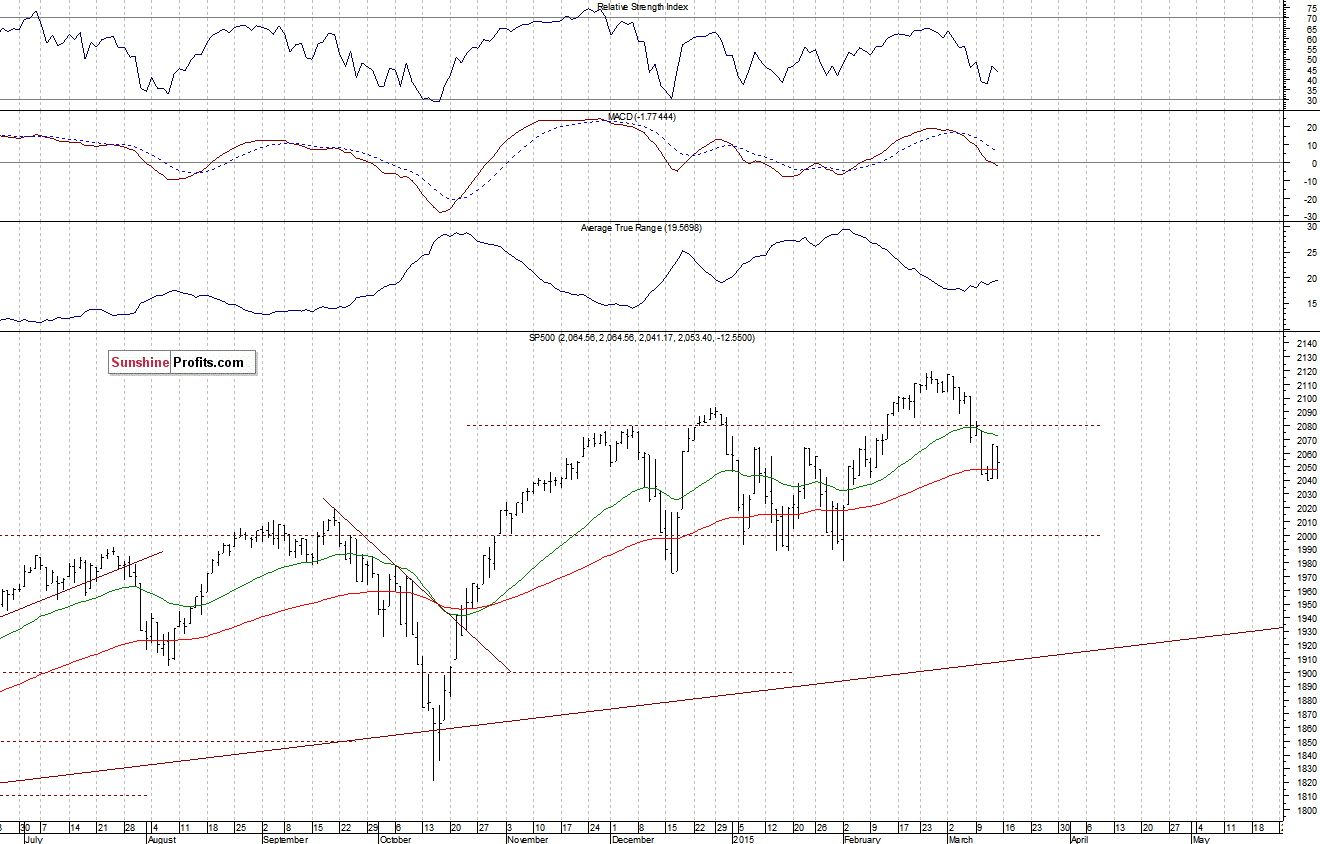
The U.S. stock market indexes lost 0.5-0.8% on Friday, extending their short-term fluctuations following recent move down. The S&P 500 index continues to trade along the level of 2,050. There have been no confirmed short-term positive signals so far. The nearest important level of resistance is at around 2,060-2,065, marked by local highs. On the other hand, support level is at 2,040, as we can see on the daily chart:
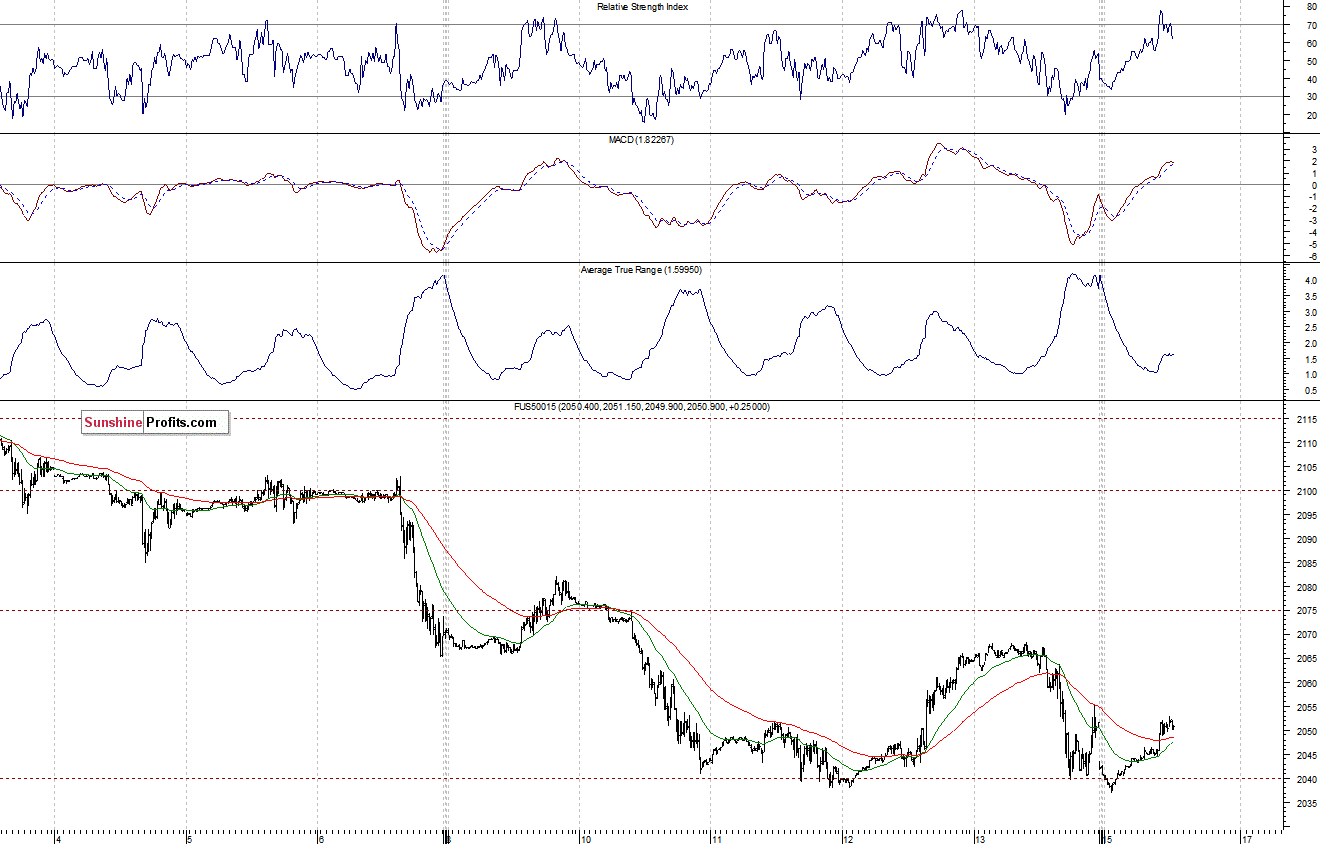
Expectations before the opening of today's trading session are positive, with index futures currently up 0.4%. The main European stock market indexes have gained 0.5-1.1% so far. Investors will now wait for some economic data announcements: Empire Manufacturing number at 8:30 a.m., Industrial Production, Capacity Utilization at 9:15 a.m., NAHB Housing Market Index at 10:00 a.m. The S&P 500 futures contract (CFD) is in an intraday uptrend, as it retraces last week's move down. The nearest important level of resistance is at around 2,050, and support level is at 2,035-2,040:
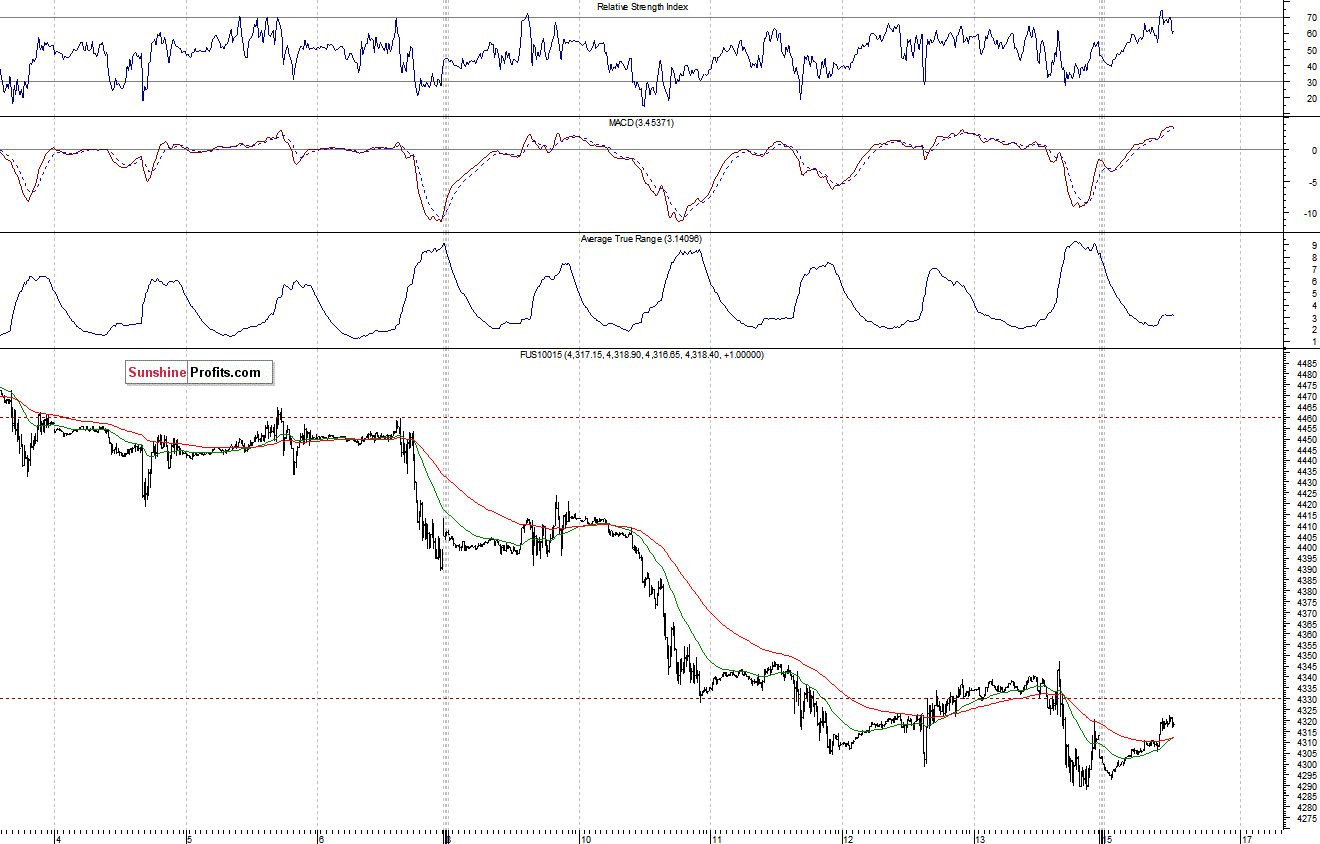
The technology Nasdaq 100 futures contract (CFD) follows a similar path, as it retraces its recent move down. The nearest important level of support is at 4,280-4,300 and resistance level is at 4,320, as the 15-minute chart shows:
Concluding, the broad stock market extended its short-term fluctuations following recent move down. For now, it looks like a flat correction within a downtrend. Therefore, we continue to maintain our speculative short position (opened on February 18 at 2,099.16, S&P 500 index), as we expect some more downside. Stop-loss level is at 2,090 (S&P 500 index) and potential profit target is at 1,980. You can trade S&P 500 index using futures contracts (S&P 500 futures contract - SP, E-mini S&P 500 futures contract - ES) or an ETF like the SPDR S&P 500 ETF - SPY. It is always important to set some exit price level in case some events cause the price to move in the unlikely direction. Having safety measures in place helps limit potential losses while letting the gains grow.
Thank you.
Paul Rejczak
Stock Trading Strategist
Stock Trading Alerts
