
Stock Trading Alert originally sent to subscribers on September 12, 2014, 7:24 AM.
Briefly: In our opinion, speculative short positions are favored (with stop-loss at 2,030 and a profit target at 1,900, S&P 500 index)
Our intraday outlook is bearish, and our short-term outlook is bearish:
Intraday
(next 24 hours) outlook: bearish
Short-term (next 1-2 weeks) outlook: bearish
Medium-term (next 1-3 months) outlook: neutral
Long-term outlook (next year): bullish
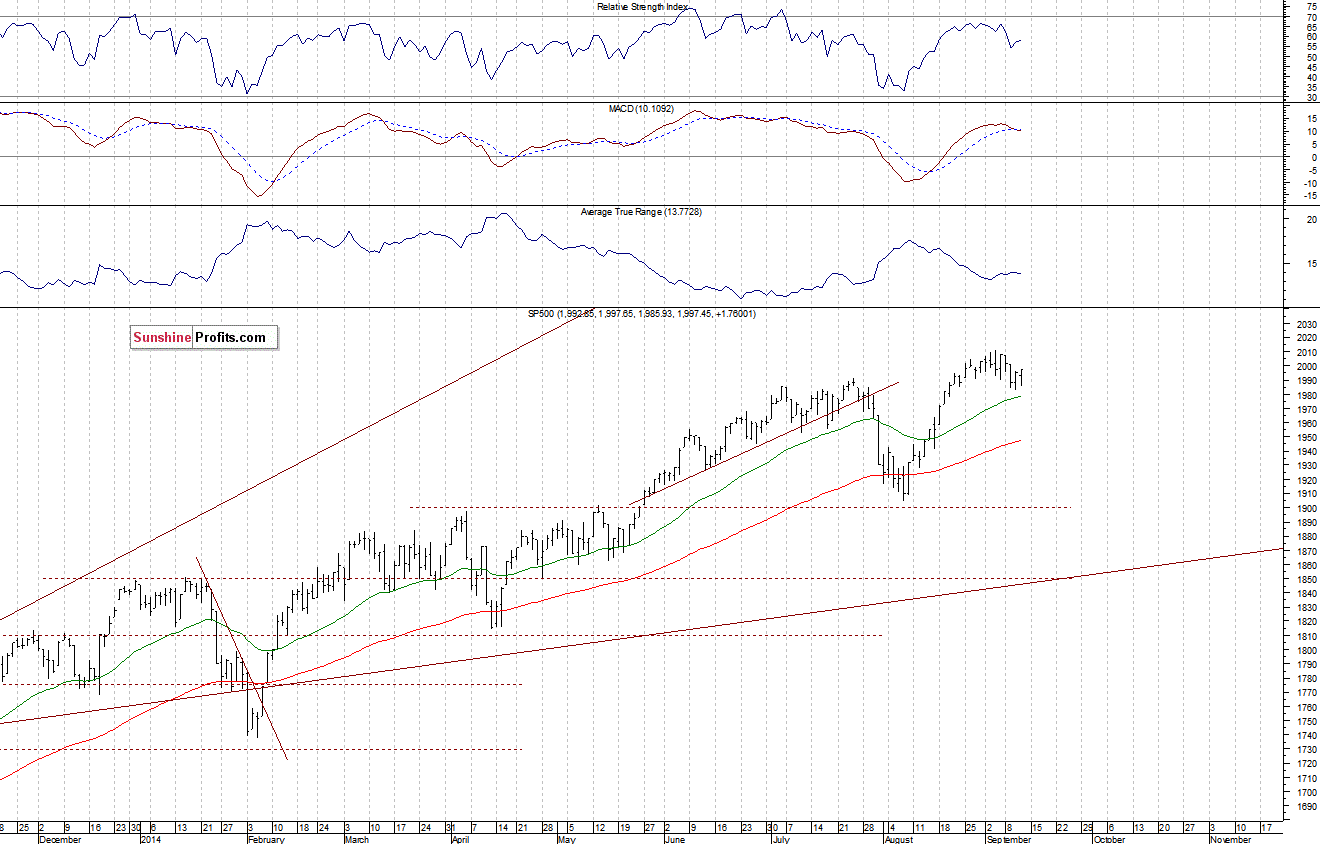
The U.S. stock market indexes were mixed between -0.1% and +0.1% on Thursday, extending their recent fluctuations, as investors continued to hesitate following some mixed economic data releases, among others. The S&P 500 index remains relatively close to its all-time high of 2,011.17. The resistance level is at around 2,000-2,010, and the nearest important level of support remains at 1,980-1,985, marked by local lows. There have been no confirmed sell signals. However, we still can see some negative technical divergences, accompanied by overbought conditions:
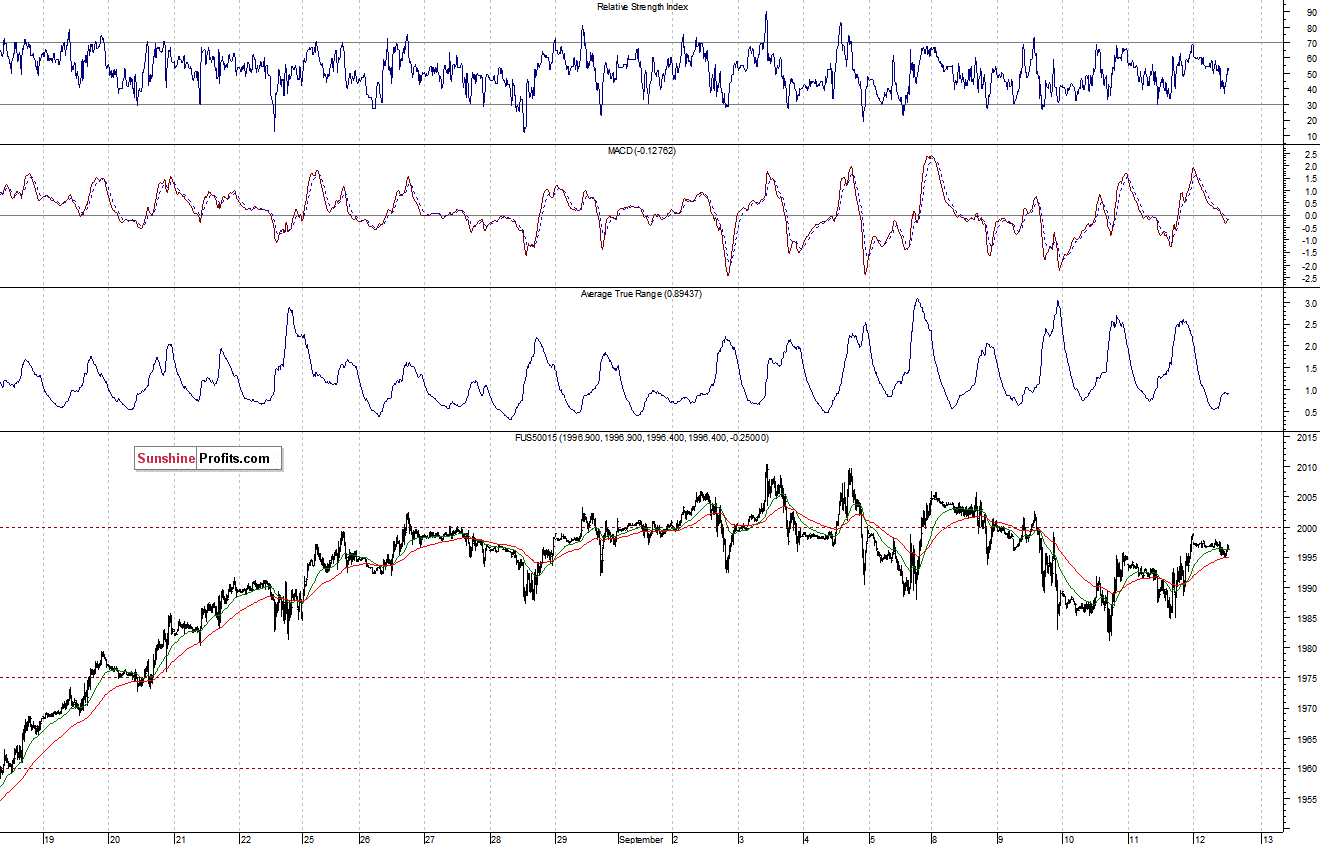
Expectations before the opening of today’s session are virtually flat. The main European stock market indexes have been mixed so far. Investors will now wait for some economic data announcements: Retail Sales at 8:30 a.m., Michigan Sentiment at 9:55 a.m., Business Inventories at 10:00 a.m. The Business Inventories number tracks the dollar amount of inventories held by retailers, wholesalers and manufacturers, as it is the amount of all products available to sell to other businesses or end consumer. This data release shows the direction of production demand going forward. The S&P 500 futures contract (CFD) extends its short-term fluctuations along the level of 2,000. The resistance level remains at around 2,000-2,010. On the other hand, the level of support is at 1,980-1,985, as we can see on the 15-minute chart:
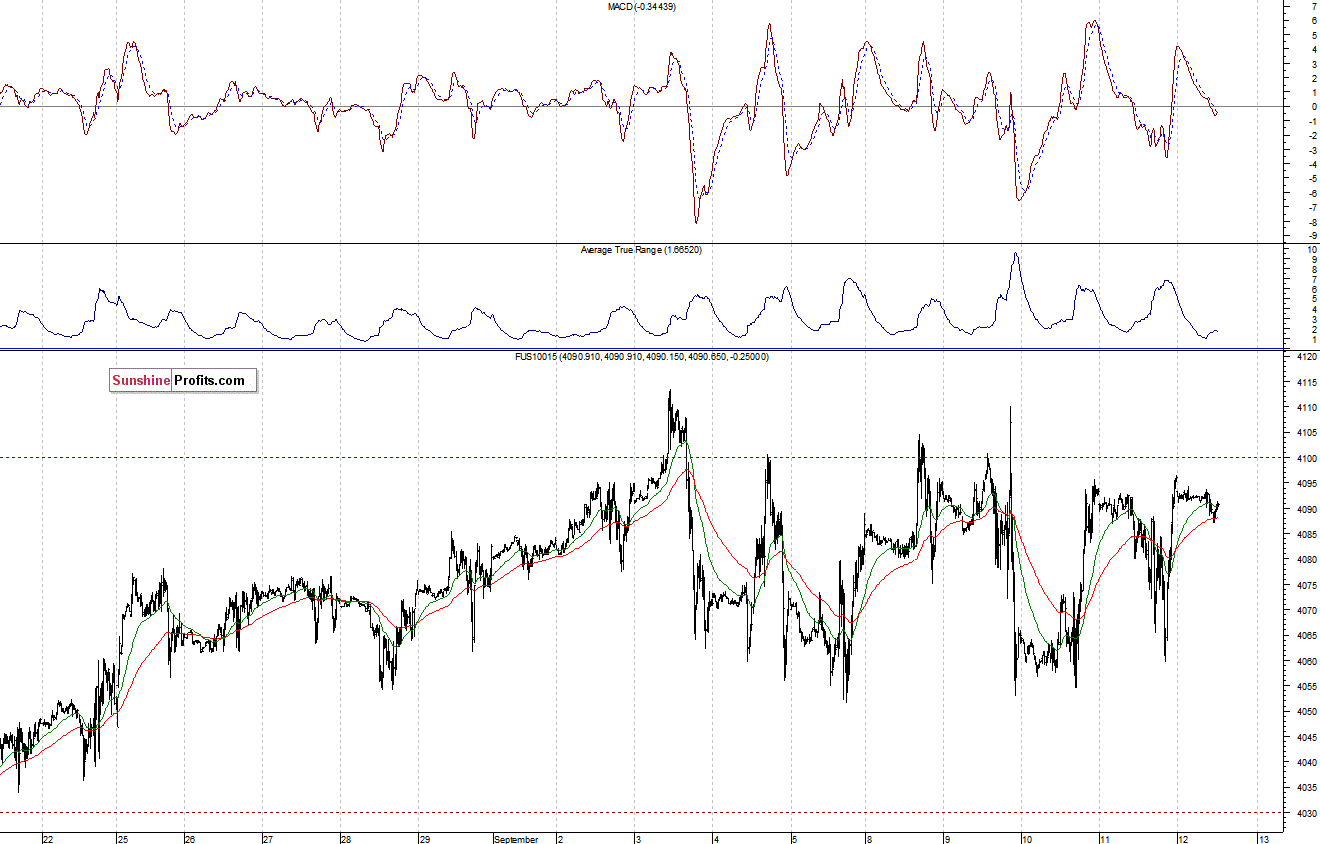
The technology Nasdaq 100 futures contract (CFD) follows a similar path, as it trades slightly below the level of 4,100. The nearest important resistance level is at around 4,100-4,115, and the support level is at 4,050-4,060, marked by recent local lows, as the 15-minute chart shows:
Concluding, the broad stock market retraced some of its month-long advance as the S&P 500 index broke below the level of 2,000. We remain bearish, expecting a downward correction or uptrend reversal. Therefore, we continue to maintain our already profitable speculative short position with entry point at 2,000.5 (S&P 500 index). The stop-loss is at the level of 2,030 and potential profit target is at 1,900 (S&P 500 index). It is always important to set some exit price level in case some events cause the price to move in the unlikely direction. Having safety measures in place helps limit potential losses while letting the gains grow.
Thank you.
Paul Rejczak
Stock Trading Strategist
Stock Trading Alerts
