
Stock Trading Alert originally sent to subscribers on August 29, 2014, 6:08 AM.
Briefly: In our opinion, speculative short positions are favored (with stop-loss at 2,030, and a profit target at 1,900, S&P 500 index)
Our intraday outlook is bearish, and our short-term outlook is bearish:
Intraday
(next 24 hours) outlook: bearish
Short-term (next 1-2 weeks) outlook: bearish
Medium-term (next 1-3 months) outlook: neutral
Long-term outlook (next year): bullish
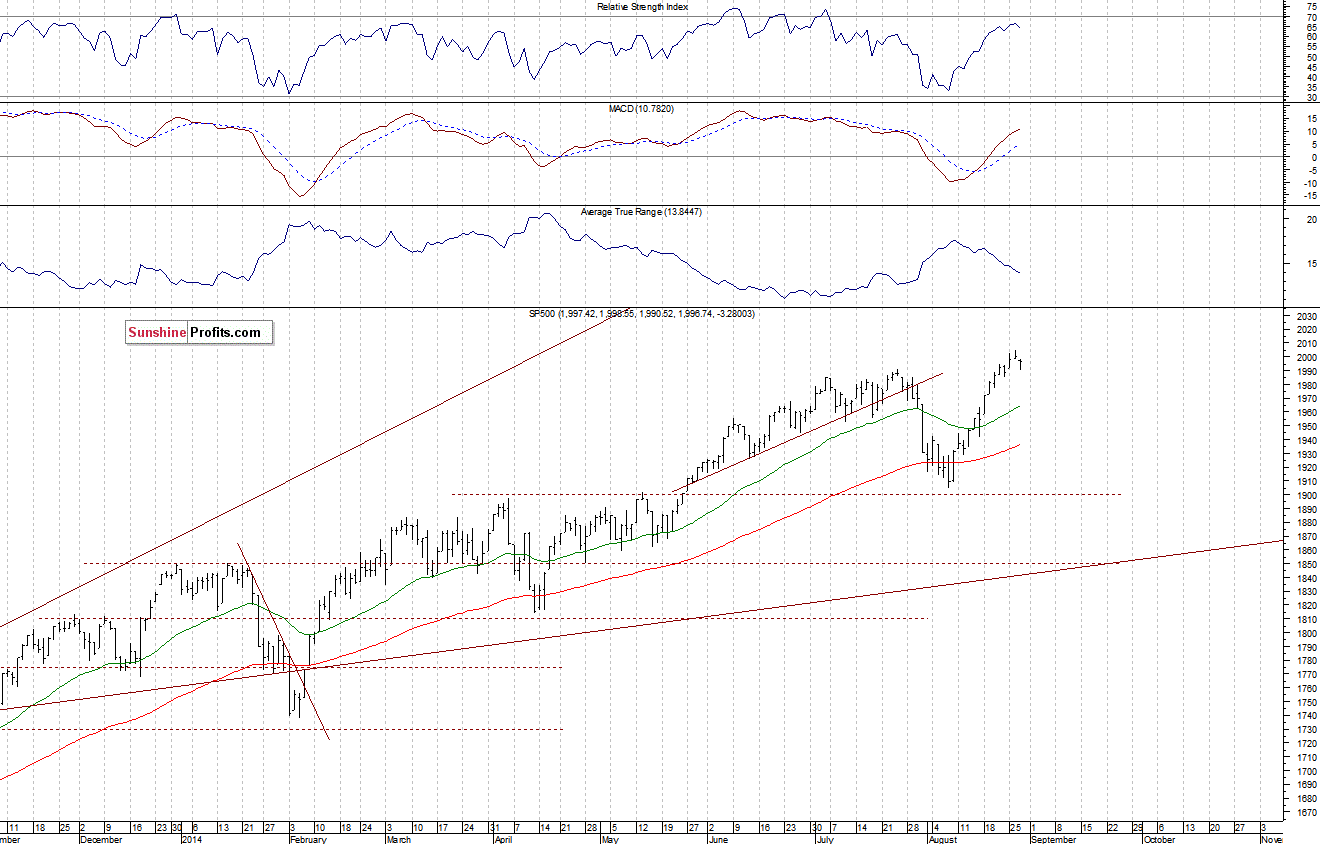
The U.S. stock market indexes lost 0.2-0.3% on Thursday, as investors took profits following recent rally. The S&P 500 index retraced some of this week’s gains. However, it remained above the level of 1,990, which is still close to its all-time high of 2,005.04. The nearest important level of resistance is at around 2,000-2,005, marked by the record high. On the other hand, the support level is at 1,980-1,990, marked by some of the recent local lows. There have been no confirmed negative signals so far. However, we can see negative divergences, accompanied by overbought conditions:
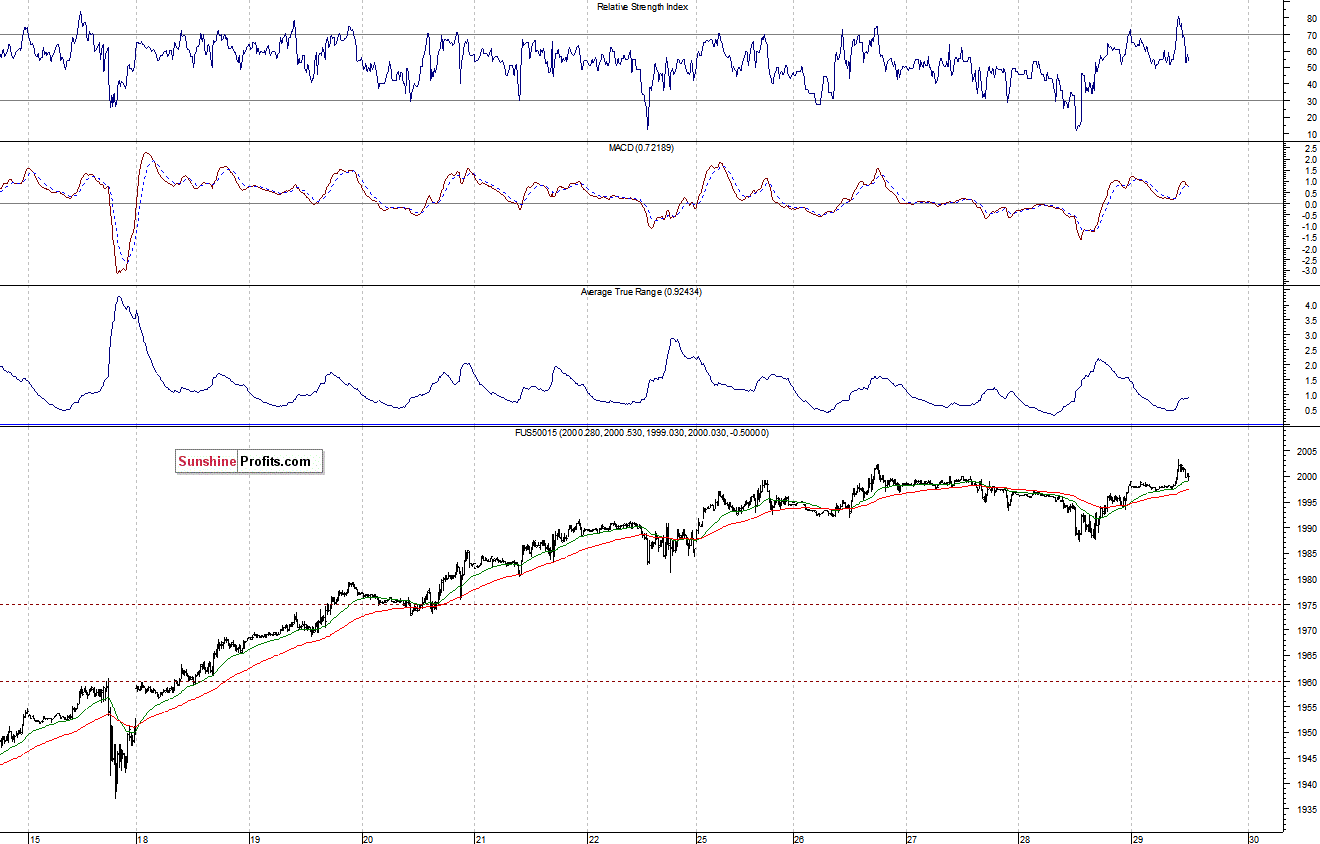
Expectations before the opening of today’s session are positive, with index futures currently up 0.2%. The main European stock market indexes have gained 0.1-0.3% so far. Investors will now wait for some economic data announcements: Personal Income, Personal Spending, PCE Prices – Core number at 8:30 a.m., Chicago PMI at 9:45 a.m., Michigan Sentiment at 9:55 a.m. Personal Income figures are the biggest determinant of future consumer demand. Therefore, investors watch those numbers closely. The S&P 500 futures contract (CFD) is in an intraday uptrend, as it trades close to new record high. The nearest level of support is at around 1,985-1,990, marked by recent local lows, as we can see on the 15-minute chart:
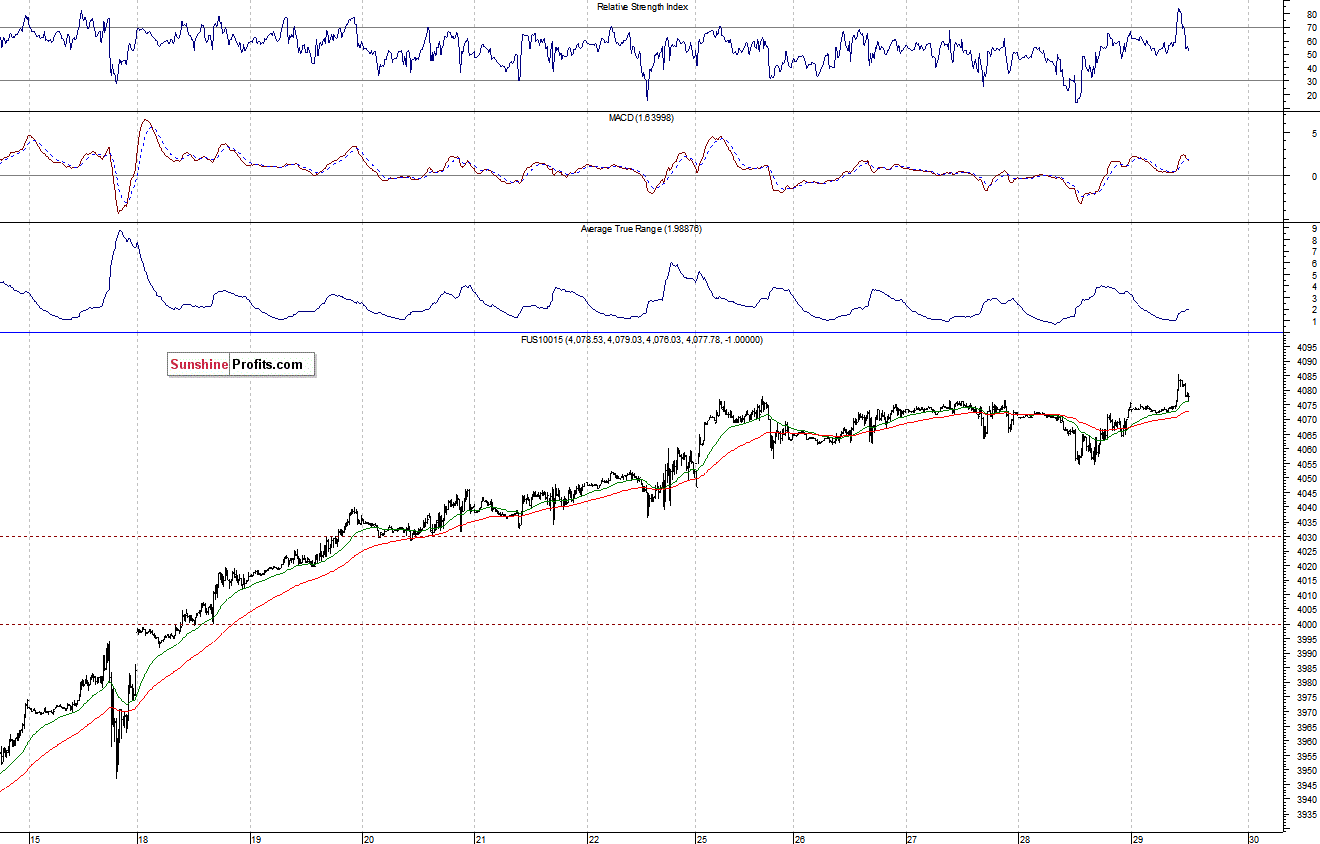
The technology Nasdaq 100 futures contract (CFD) follows a similar path, as it reaches new long-term high. Potential resistance level is at around 4,100. On the other hand, the level of support remains at 4,050-4,060, marked by recent local lows, as the 15-minute chart shows:
Concluding, the broad stock market remains close to its all-time highs. However, there are some negative technical divergences, accompanied by overbought conditions which may lead to a downward correction. We remain bearish, maintaining our speculative short position, with entry point at 2,000.5 – S&P 500 index. The stop-loss is at 2,030, and potential profit target is at 1,900 (S&P 500 index).
Thank you.
Paul Rejczak
Stock Trading Strategist
Stock Trading Alerts
