
Stock Trading Alert originally sent to subscribers on August 25, 2014, 7:10 AM.
Briefly: In our opinion, no speculative positions are justified.
Our intraday outlook is neutral, and our short-term outlook is neutral:
Intraday
(next 24 hours) outlook: neutral
Short-term (next 1-2 weeks) outlook: neutral
Medium-term (next 1-3 months) outlook: neutral
Long-term outlook (next year): bullish
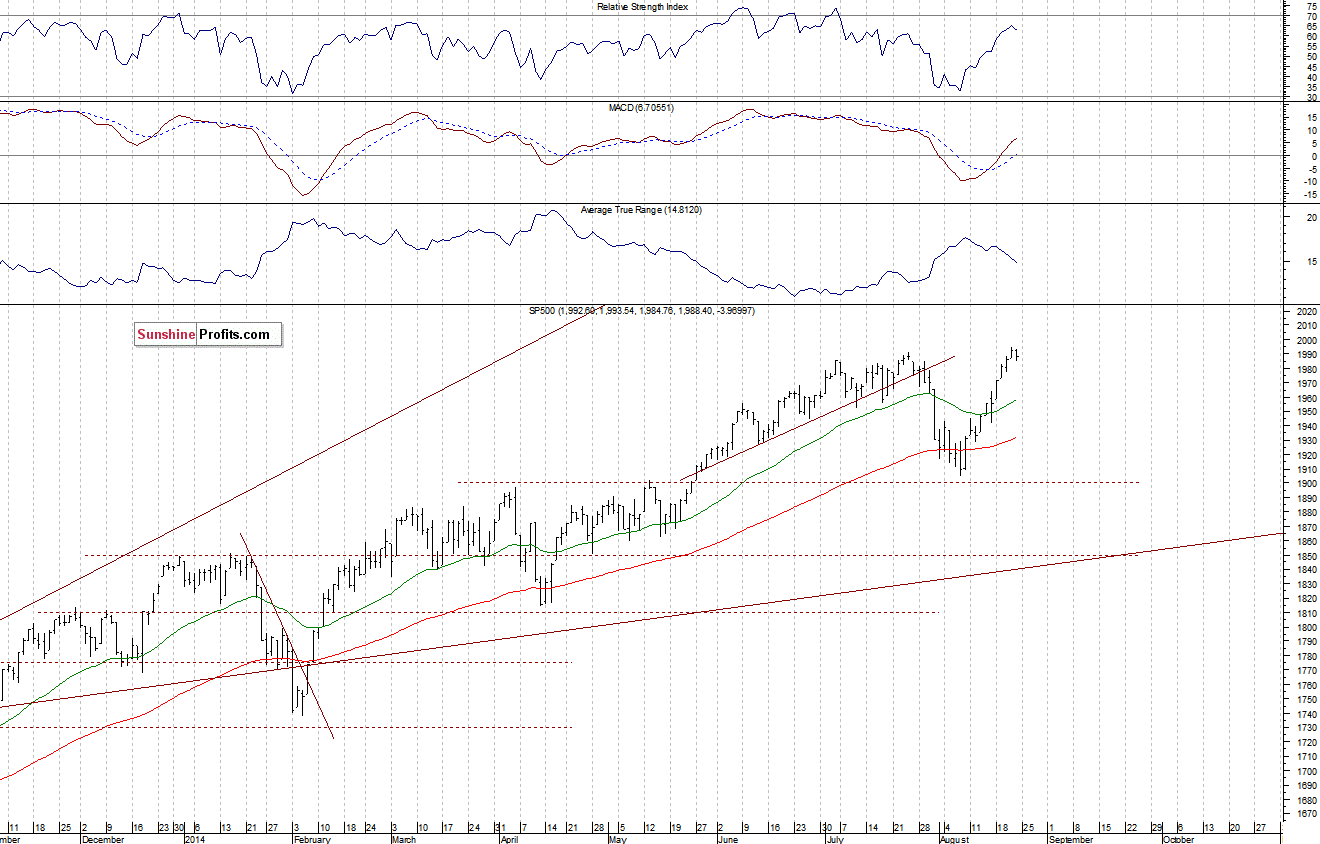
The U.S. stock market indexes were mixed between -0.2% and +0.1% on Friday, as investors hesitated following Janet Yellen’s speech at Fed’s Jackson Hole Conference. Our Friday’s neutral intraday outlook has proved accurate. The S&P 500 index remains close to its Thursday’s all-time of 1,994.76, slightly below the level of 2,000. The nearest important resistance level is at 1,990-2,000, and the level of support is at 1,970, among others. There have been no confirmed negative signals so far, however, we can see some overbought conditions which may lead to a downward correction:
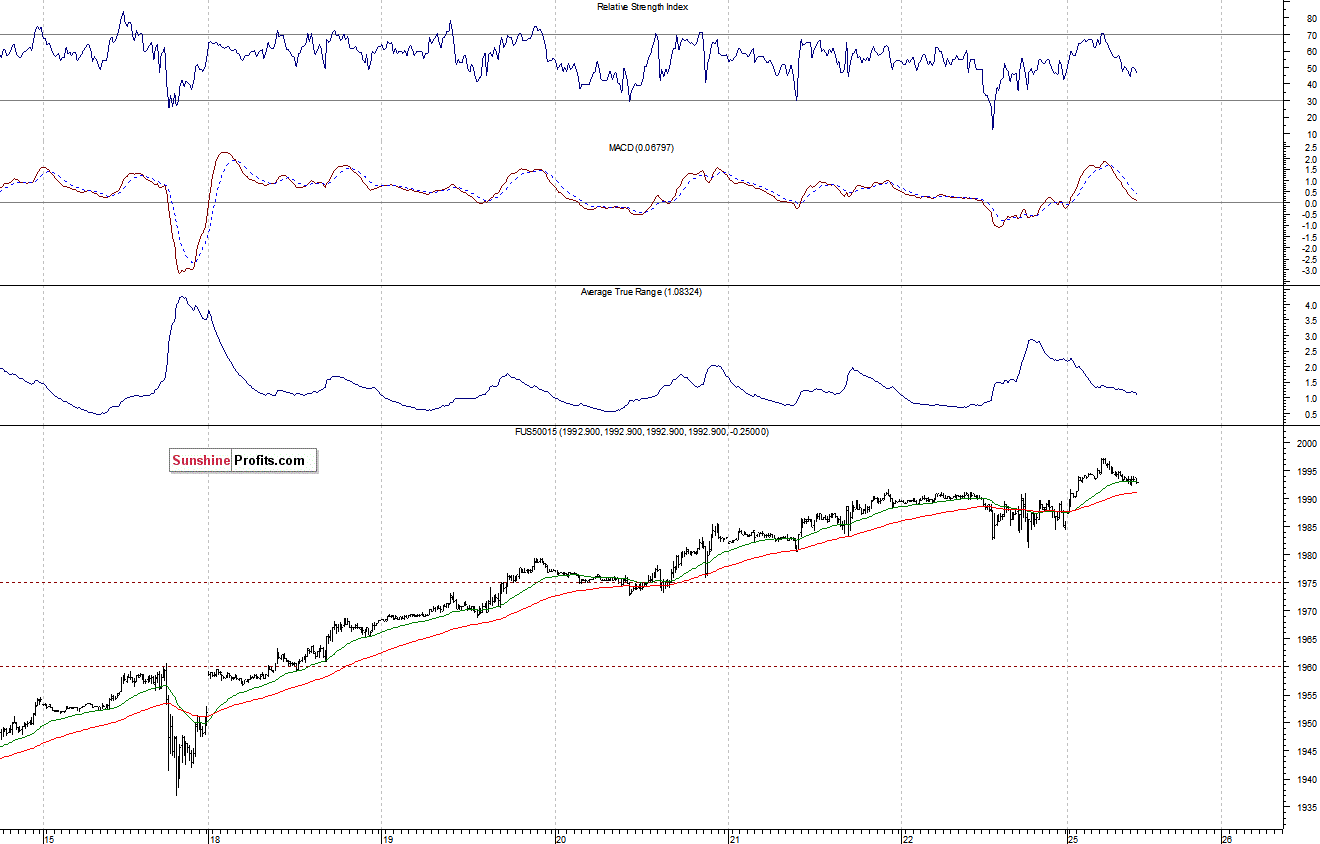
Expectations before the opening of today’s session are slightly positive, with index futures currently up 0.2-0.3%. The main European stock market indexes have gained 0.9-1.0% so far. Investors will now wait for the New Home Sales data release at 10:00 a.m. This report indicates the level of new privately owned one-family houses sold and for sale. However, it is considered to be a lagging indicator of demand in the market. The S&P 500 futures contract (CFD) trades close to its new intraday all-time high, just below the level of 2,000. On the other hand, the level of support is at around 1,980-1,985, marked by recent local lows, as we can see on the 15-minute chart:
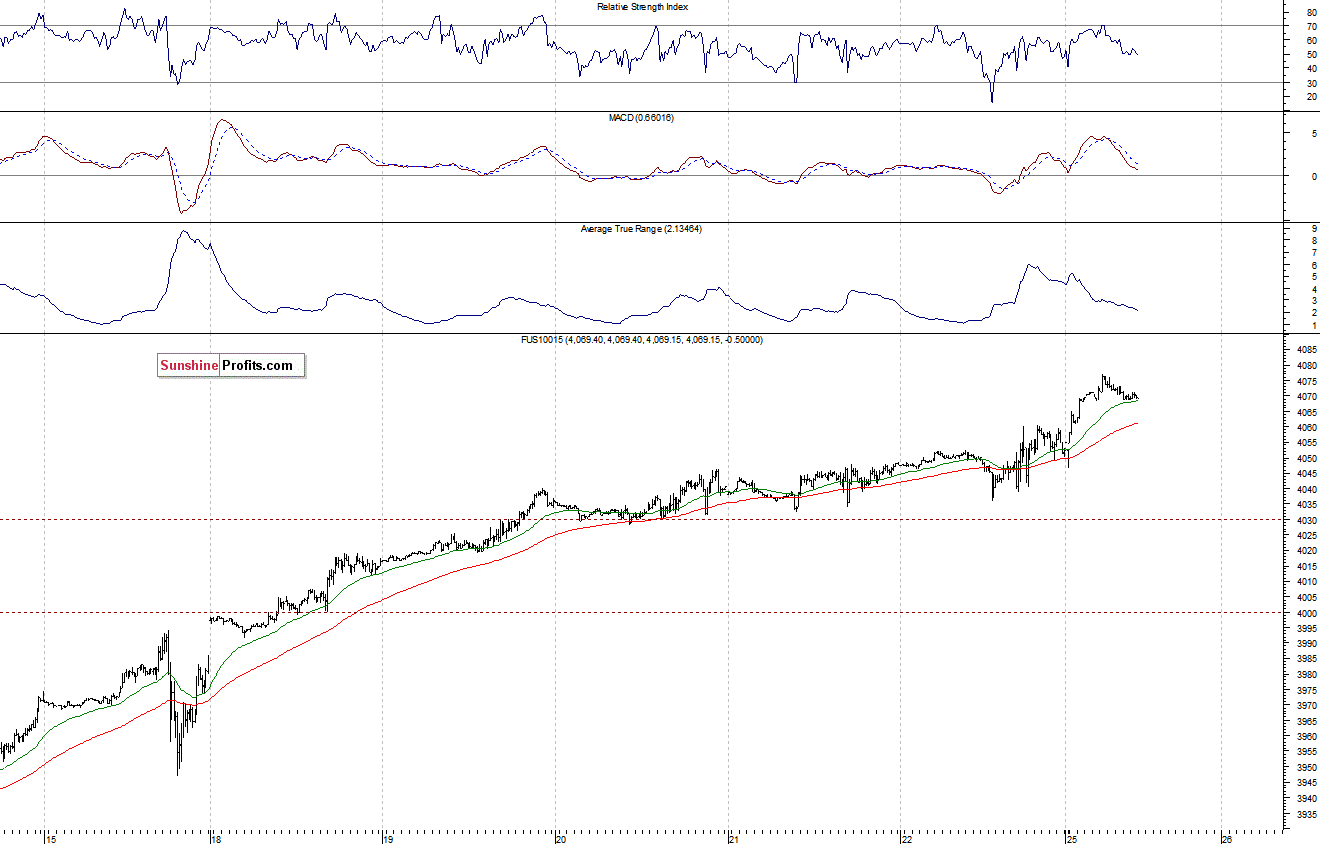
The technology Nasdaq 100 futures contract (CFD) follows a similar path, as it trades just below its long-term high. The nearest important resistance level is at around 4,080-4,100, and the support level is at 4,050-4,060, among others, as the 15-minute chart shows:
Concluding, the broad stock market extends its uptrend, as the S&P 500 index trades close to the level of 2,000. There have been no confirmed negative signals so far. However, there are some negative technical divergences, accompanied by short-term overbought conditions. In our opinion, no speculative positions are justified. We still prefer to be out of the market , just to avoid low risk/reward ratio trades. We will let you know when we think it is safe to get back in the market.
Thank you.
Paul Rejczak
Stock Trading Strategist
Stock Trading Alerts
