
Stock Trading Alert originally sent to subscribers on August 21, 2014, 5:55 AM.
Briefly: In our opinion, no speculative positions are justified.
Our intraday outlook is neutral, and our short-term outlook is neutral:
Intraday (next 24 hours) outlook: neutral
Short-term (next 1-2 weeks) outlook: neutral
Medium-term (next 1-3 months) outlook: neutral
Long-term outlook (next year): bullish
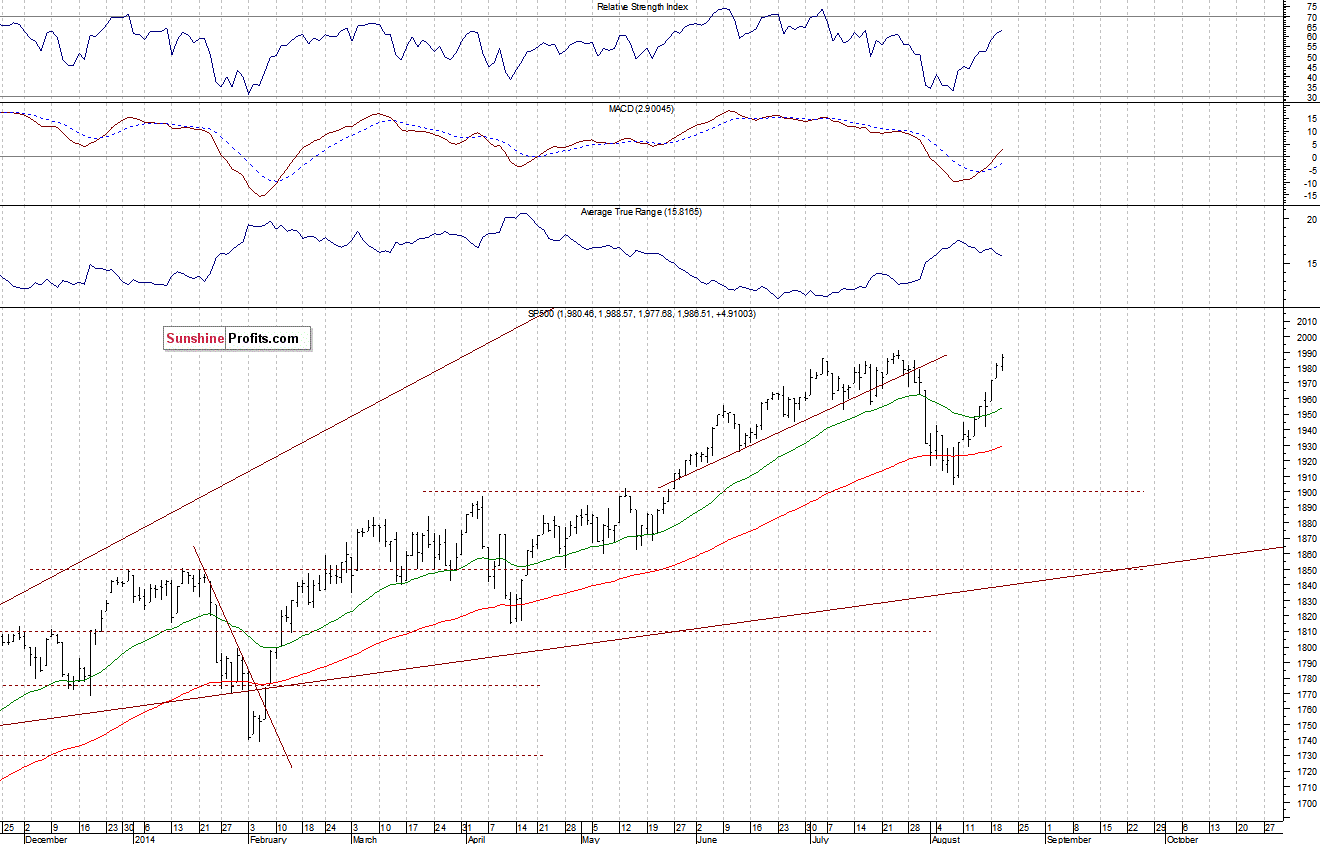
The main U.S. stock market indexes were mixed between 0.0% and +0.3% on Wednesday, slightly extending their recent move up, as investors awaited economic data announcements, Fed’s Jackson Hole Conference. The S&P 500 index got even closer to its July 24 all-time high of 1,991.39, as it posted daily high at 1,988.57. The nearest important resistance level is at 1,990-2,000, and the level of support is at 1,970, marked by some of the recent local lows, among others. There have been no confirmed negative signals so far. However, we can see negative technical divergences, accompanied by some overbought conditions:
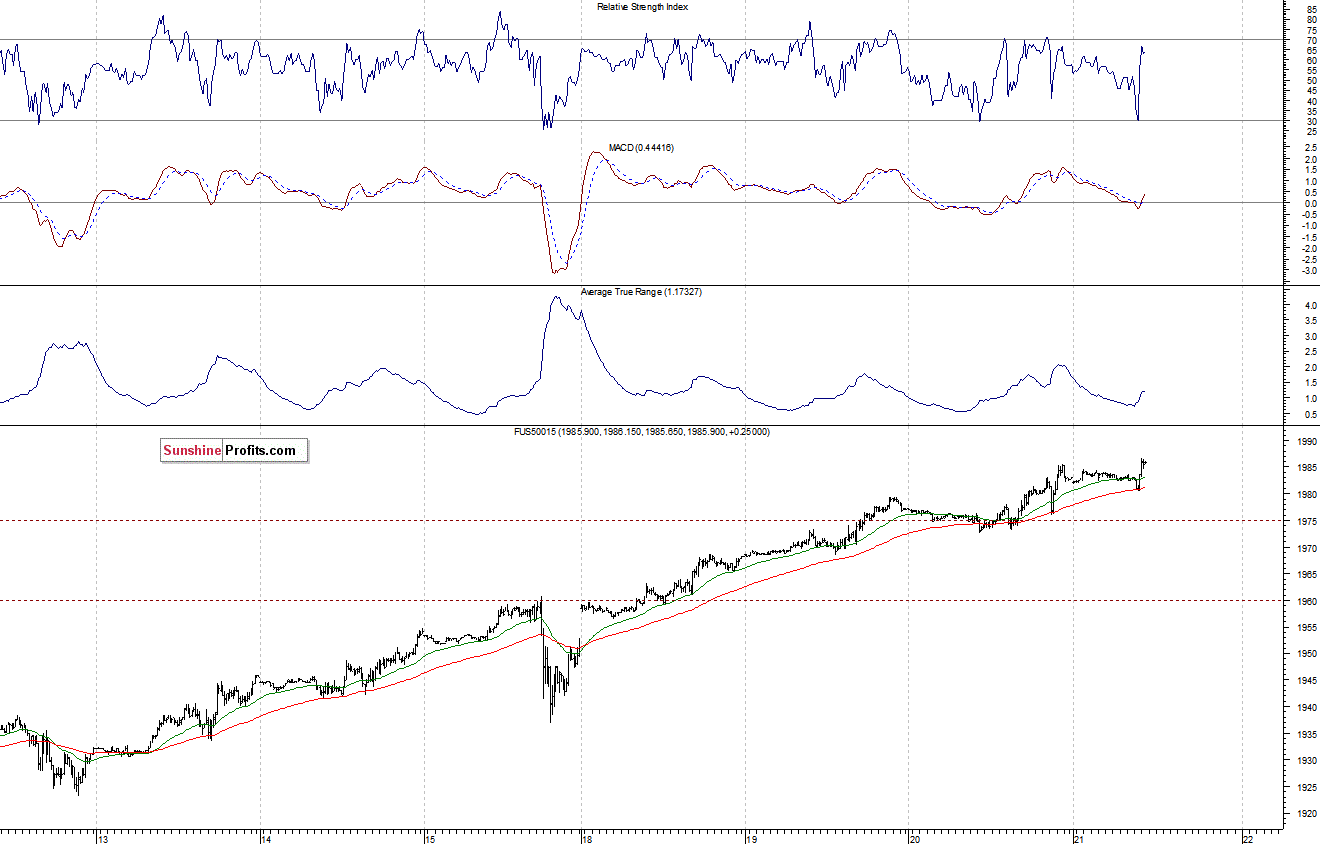
Expectations before the opening of today’s session are slightly positive, with index futures currently up 0.1-0.2%. The European stock market indexes have gained 0.3-0.5% so far. Investors will now wait for some economic data announcements: Initial Claims at 8:30 a.m., Existing Home Sales, Leading Indicators, Philadelphia Fed at 10:00 a.m. The Philadelphia Fed Survey is an indicator of trends in the manufacturing sector, and it can have a significant effect on the stock market. The S&P 500 futures contract (CFD) remains close to its long-term highs, as it trades along the level of 1,985. The level of resistance is at around 2,000. On the other hand, the support level remains at around 1,975, marked by recent local lows, as the 15-minute chart shows:
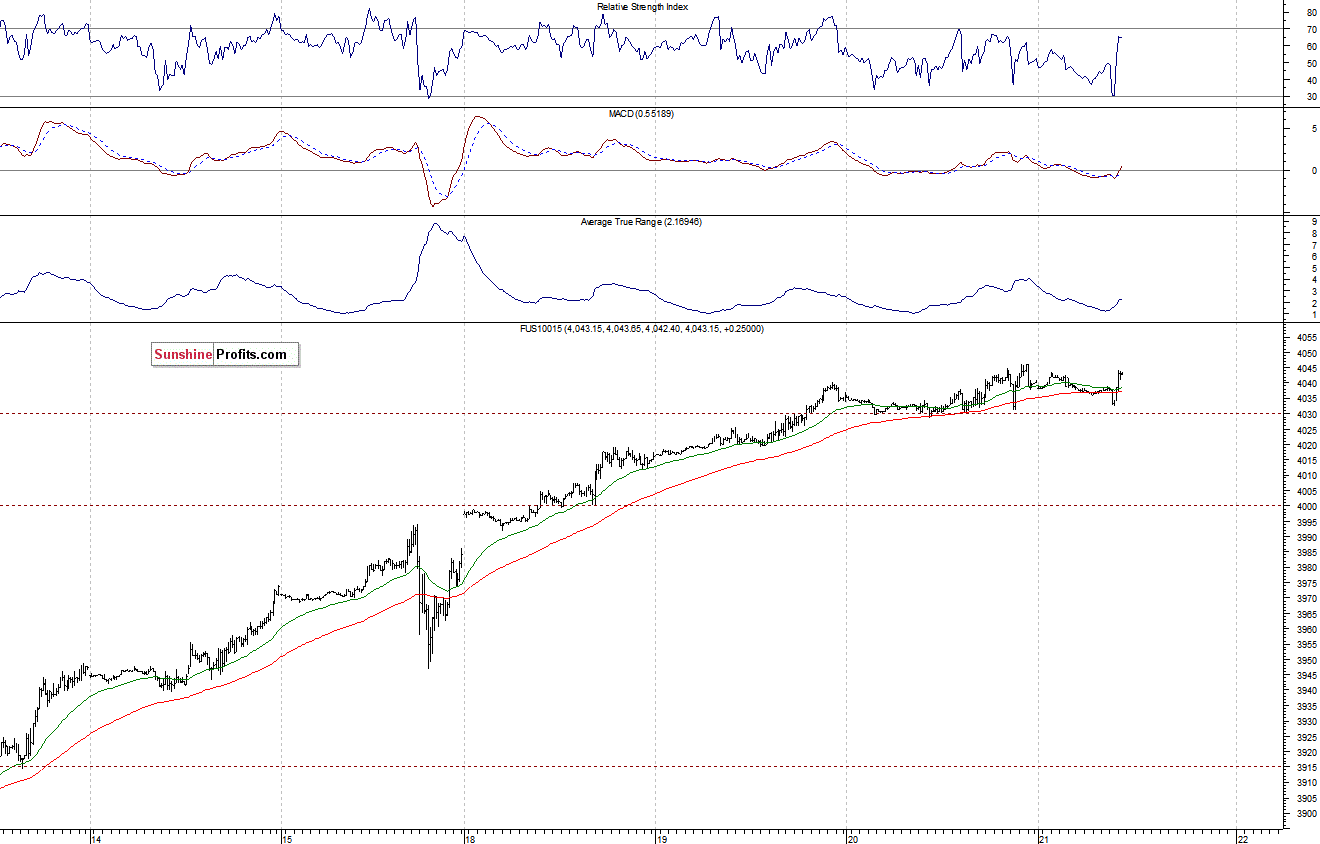
The technology Nasdaq 100 futures contract (CFD) is in a short-term consolidation, as it trades above the level of 4,000. The nearest important resistance level is at around 4,050, and the support level is at 4,030, among others. There have been no confirmed negative signals so far:
Concluding, the broad stock market remains close to its record highs, as investors’ sentiment is still positive. However, there are some overbought conditions which may lead to a downward correction. In our opinion, no speculative positions are justified at this moment. We prefer to be out of the market, avoiding low risk/reward ratio trades. We will let you know when we think it is safe to get back in the market.
Thank you.
Paul Rejczak
Stock Trading Strategist
Stock Trading Alerts
