
Stock Trading Alert originally sent to subscribers on August 18, 2014, 6:27 AM.
Briefly: In our opinion, speculative short positions are favored (with stop-loss at 1,970 and a profit target at 1,850, S&P 500 index)
Our intraday outlook is bearish, and our short-term outlook remains bearish:
Intraday
(next 24 hours) outlook: bearish
Short-term (next 1-2 weeks) outlook: bearish
Medium-term (next 1-3 months) outlook: neutral
Long-term outlook (next year): bullish
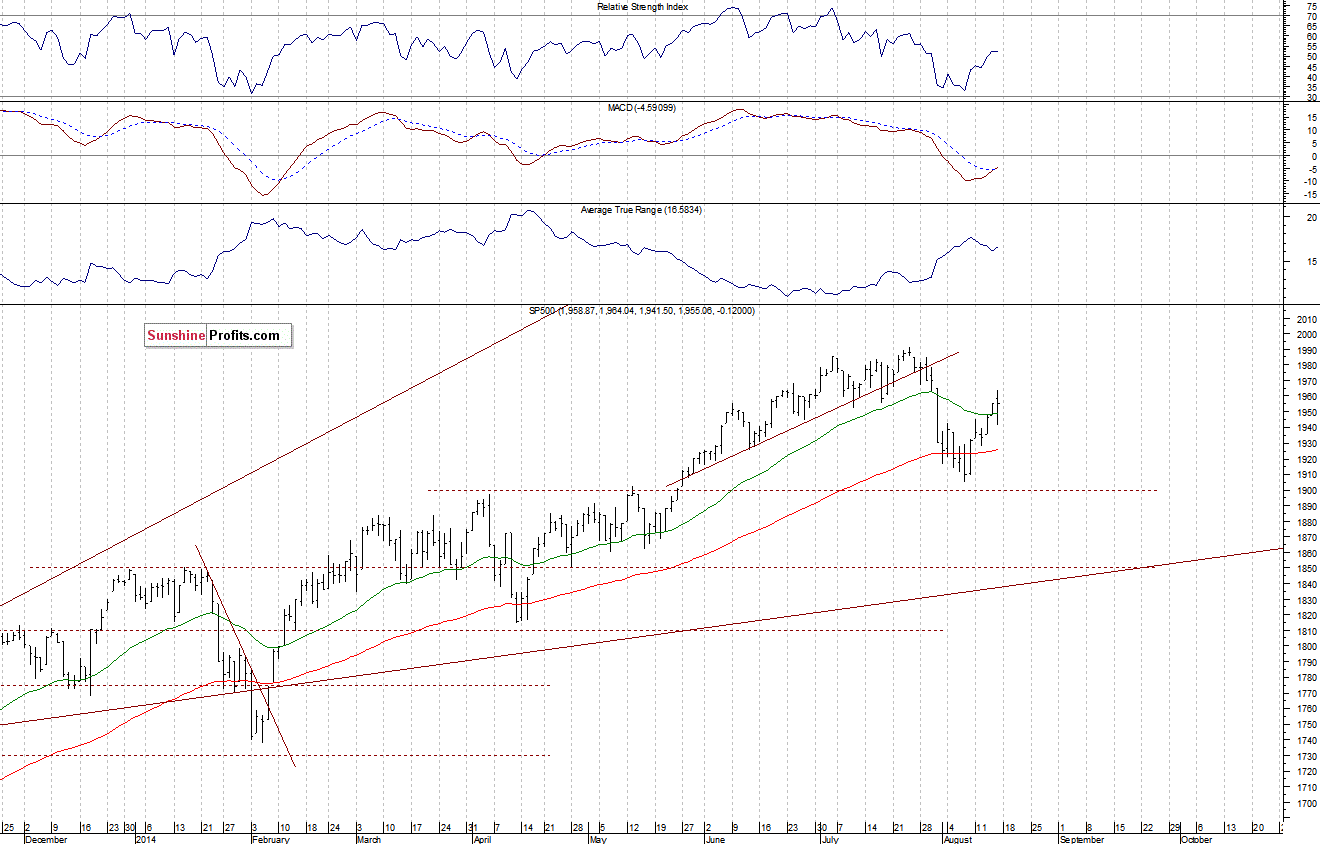
The U.S. stock market indexes were mixed between -0.3% and +0.5% on Friday, following volatile trading session, as investors reacted to some geopolitical news concerning Russia-Ukraine conflict, among others. The S&P 500 index retraced more than half of its late July – early August decline, however, closing slightly below Fibonacci’s 61.8% retracement of 1,958.3 (with the daily high at 1,964.04). The resistance level is at around 1,970-1,980, marked by previous local highs, and the next resistance is at 1,990-2,000, marked by July 24 all-time high of 1,991.39. It still looks like a correction within a short-term uptrend, however, a bullish scenario cannot be excluded here:
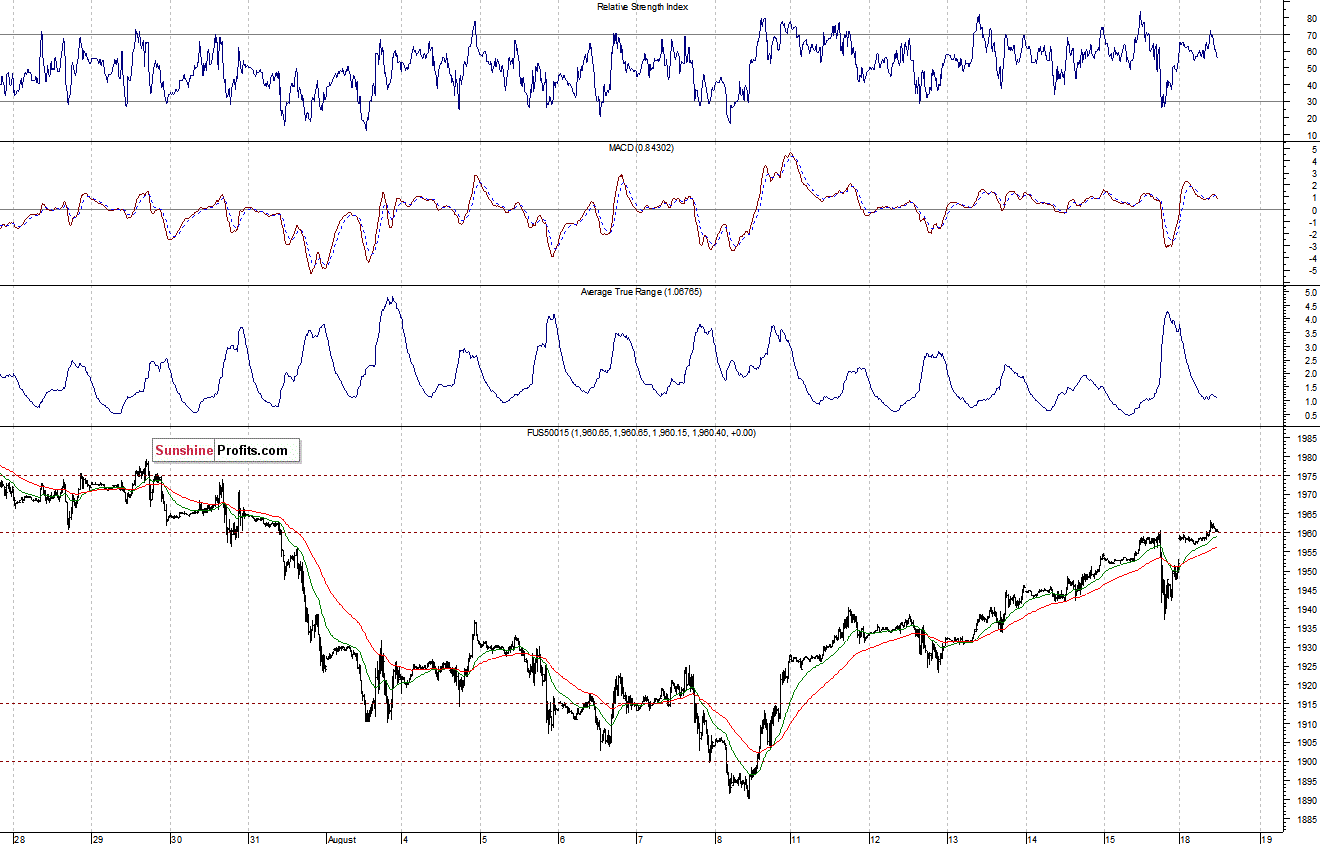
Expectations before the opening of today’s session are positive, with index futures currently up 0.5%. The main European stock market indexes have gained 0.6-1.4% so far. The S&P 500 futures contract (CFD) is in a relatively narrow intraday trading range, fluctuating along Friday’s highs. The nearest important resistance level is at around 1,960-1,965, marked by some of the previous local extremes. On the other hand, the level of support remains at 1,940, among others, as we can see on the 15-minute chart:
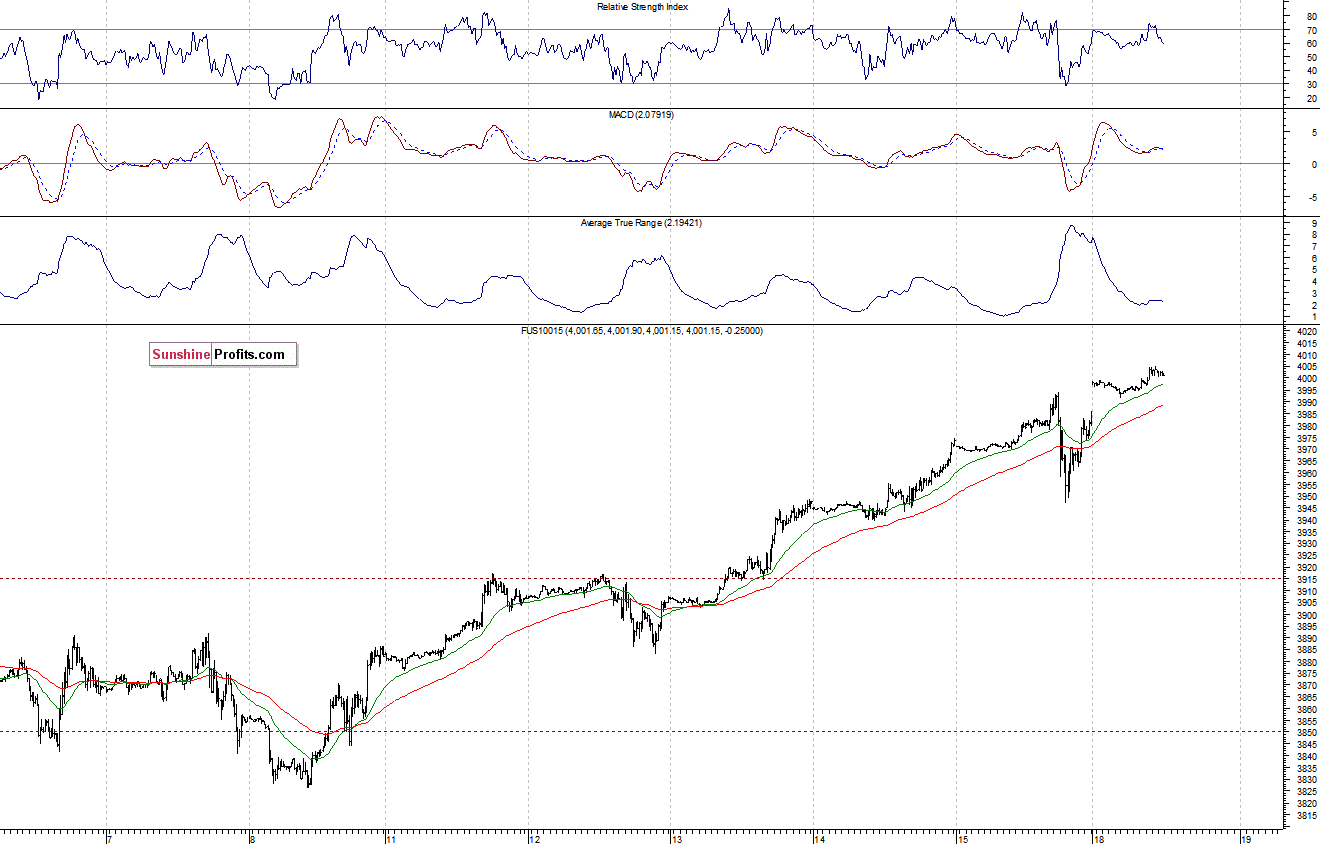
The technology Nasdaq 100 futures contract (CFD) reaches new long-term highs, as it trades close to the level of 4,000. The nearest important support level is at around 3,950-3,970, as the 15-minute chart shows:
Concluding, the broad stock market continues its recent move up, as it retraces more than half of the late July – early August sell-off. Is this a new uptrend or just a strong upward correction? We remain cautiously pessimistic, maintaining our speculative short position, with stop-loss at 1,970 (S&P 500 index). So, the price currently tracks dangerously close to our stop-loss figure. It is always important to set some exit price level in case some events cause the price to move in the unlikely direction. Having safety measures in place helps to limit potential losses while letting the gains grow.
Thank you.
Paul Rejczak
Stock Trading Strategist
Stock Trading Alerts
