
Stock Trading Alert originally sent to subscribers on July 17, 2014, 6:58 AM.
Briefly: In our opinion, no speculative positions are justified.
Our intraday outlook remains neutral, and our short-term outlook is neutral:
Intraday
(next 24 hours) outlook: neutral
Short-term (next 1-2 weeks) outlook: neutral
Medium-term (next 1-3 months) outlook: neutral
Long-term outlook (next year): bullish
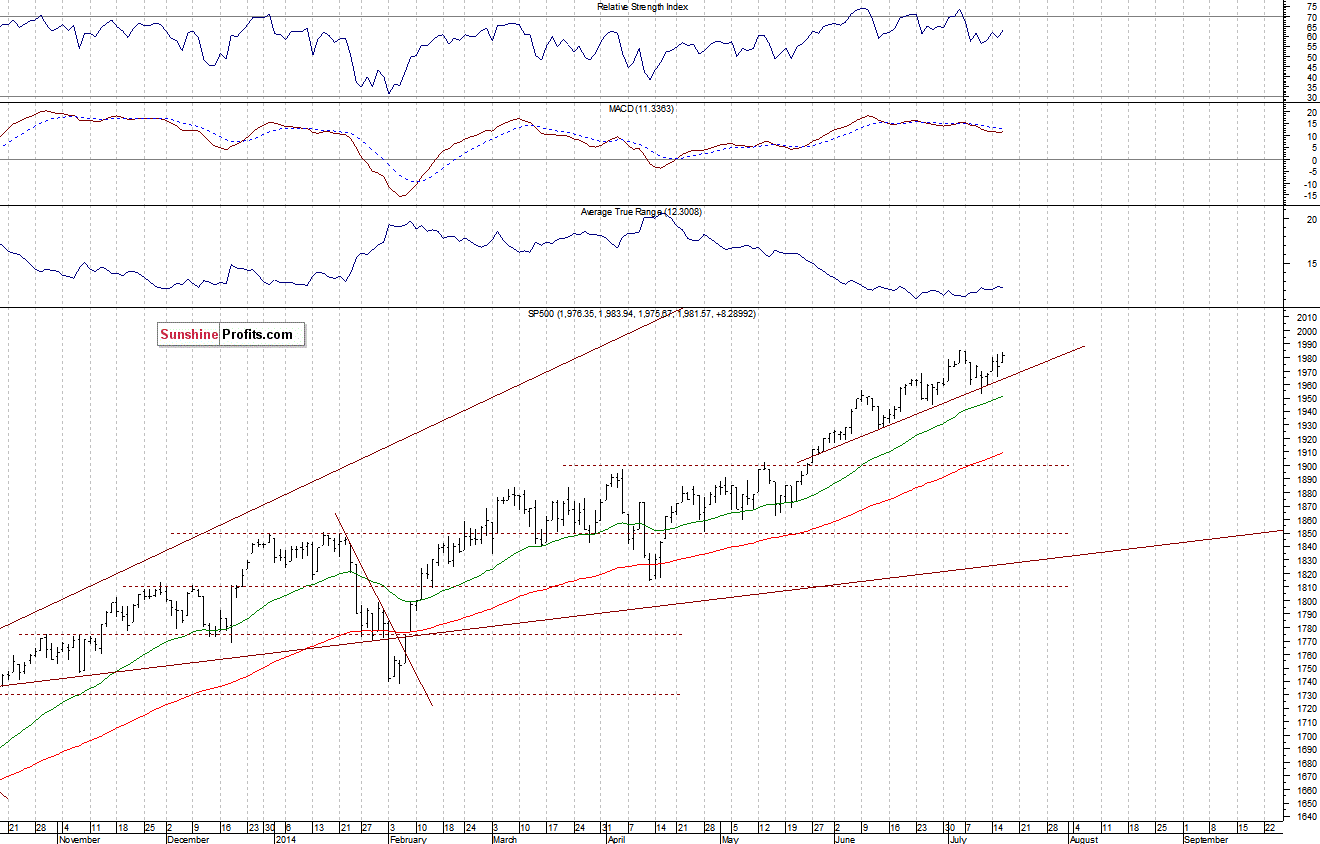
The main U.S. stock market indexes gained 0.4-0.5% on Wednesday, extending their short-term move up, as investors reacted to some better-than-expected quarterly earnings releases. The S&P 500 index remains close to its July 3 all-time high of 1,985.59. It is still above two-month-long upward trend line, which is positive. The upward trend line is a straight line that is drawn under pivot lows to show the direction of price. Trend lines are an important tool in technical analysis for both trend identification and a confirmation. As long as price remains above the upward trend line, the uptrend is considered intact. The resistance level is at around 1,980-1,985, and the next resistance is at the psychological 2,000. On the other hand, the level of support remains at 1,950-1,960, marked by recent local lows. There have been no confirmed negative signals so far, as we can see on the daily chart:
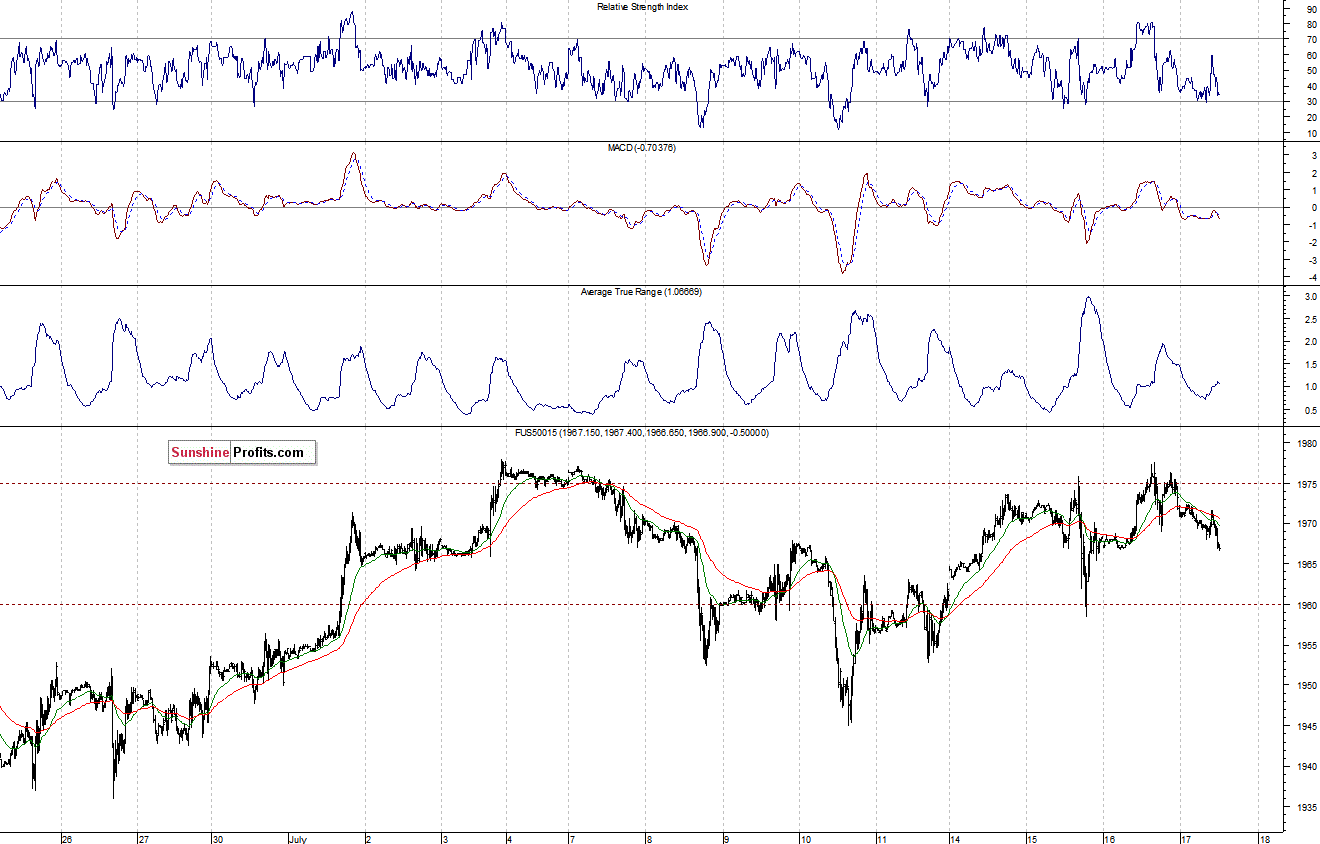
Expectations before the opening of today’s session are negative, with index futures currently down 0.3-0.5%. The European stock market indexes have lost between 0.5% and 0.9%. Investors will now wait for some economic data announcements: Initial Claims, Housing Starts, Building Permits at 8:30, Philadelphia Fed index at 10:00 a.m. The S&P 500 futures contract (CFD) is in a short-term consolidation, as it fluctuates slightly below its all-time high. The resistance level is at around 1,975, and the nearest important level of support is at 1,960, marked by recent local low, as the 15-minute chart shows:
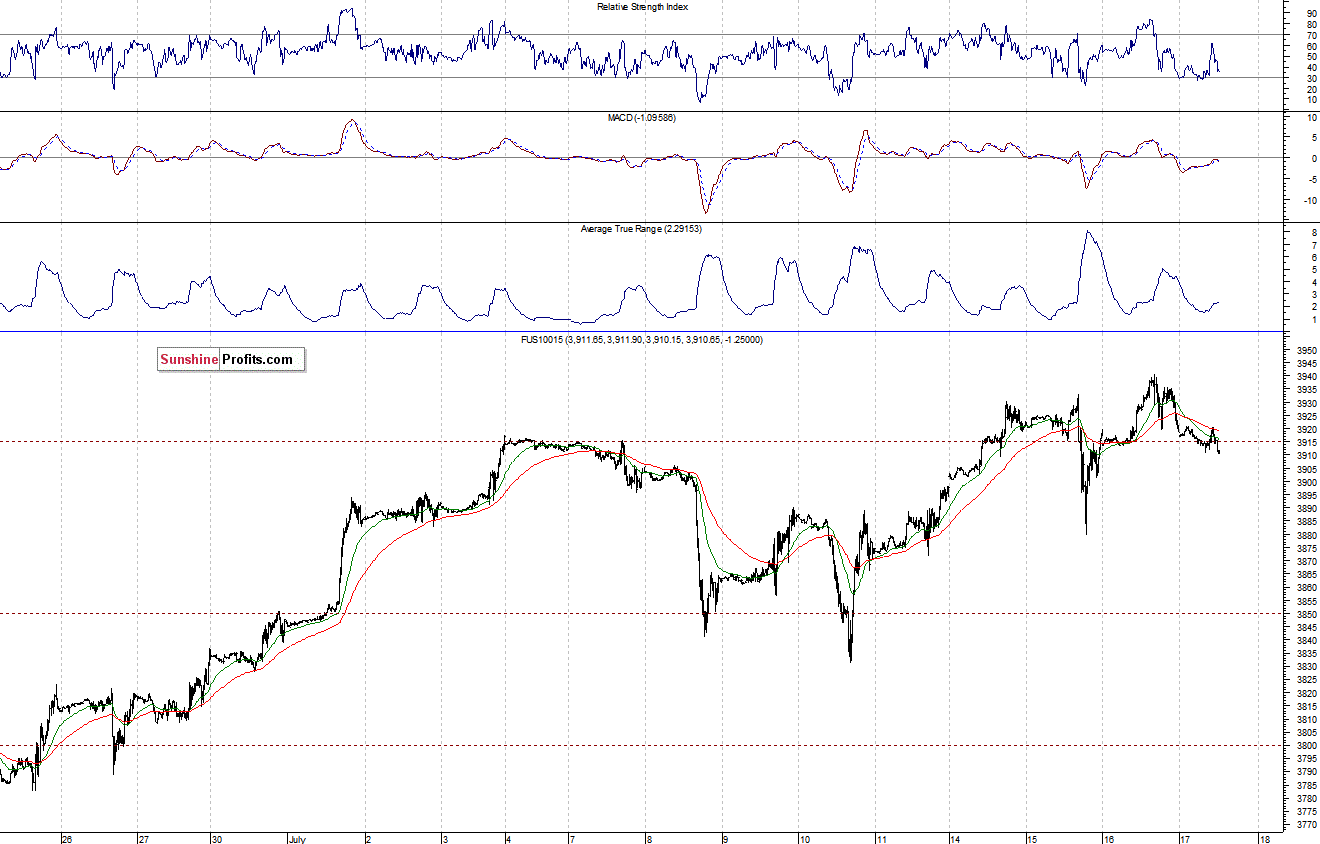
The technology Nasdaq 100 futures contract (CFD) has reached a new long-term high yesterday, close to the resistance level of 3,940. The nearest important support level is at 3,880-3,900. There have been no confirmed uptrend reversal signals so far. However, the market may be forming some sort of a topping pattern here:
Concluding, the broad stock market extends its consolidation along the level of its all-time high. There have been no confirmed negative signals so far. On the other hand, the upward potential seems limited here amid caution ahead of possible Fed policy tightening. We think that it is better to stay out of the market at this moment, as quarterly earnings releases, economic data announcements may lead to increased volatility, especially following recent run-up. So, it may be better to cut back on your trading or even move to the sidelines completely, just to avoid low risk/reward ratio trades. We will let you know when we think it is safe to get back in the market.
Due to a holiday break, beginning from this Friday until Monday, July 28, there will be no Stock Trading Alerts. We apologize for inconvenience.
Thank you.
Paul Rejczak
Stock Trading Strategist
Stock Trading Alerts
