
Stock Trading Alert originally sent to subscribers on July 3, 2014, 6:41 AM.
Briefly: In our opinion, no speculative positions are justified.
Our intraday outlook remains neutral, and our short-term outlook is neutral:
Intraday
(next 24 hours) outlook: neutral
Short-term (next 1-2 weeks) outlook: neutral
Medium-term (next 1-3 months) outlook: neutral
Long-term outlook (next year): bullish
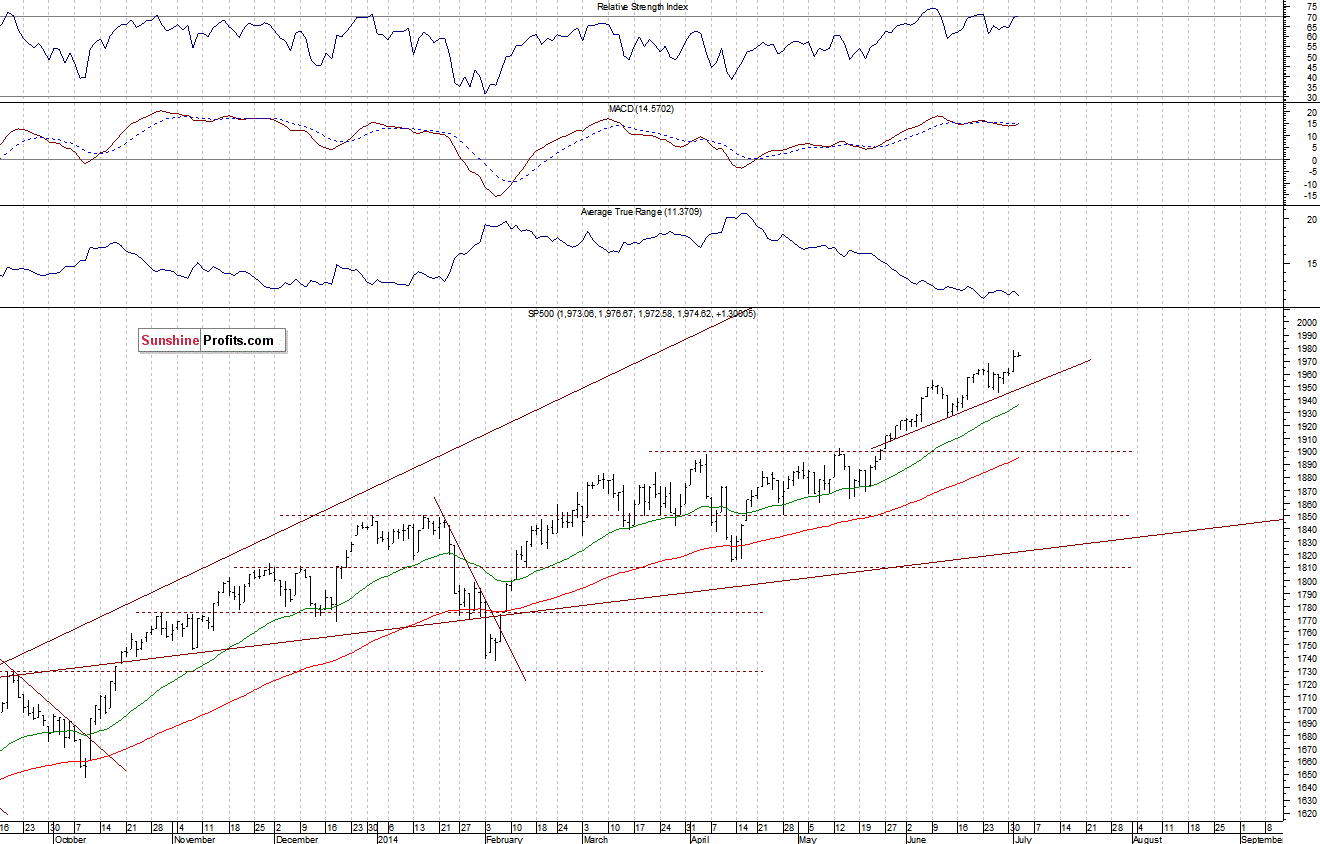
The U.S. stock market indexes gained 0.1% on Wednesday, as investors reacted to some better-than-expected economic data releases. Our yesterday’s neutral intraday outlook has proved to be accurate. The S&P 500 index remained slightly below its Tuesday’s all-time high of 1,978.58. The nearest important resistance level is at around 1,980, and the next level of resistance is at the psychological 2,000. On the other hand, the support level is at 1,960, marked by some of the recent local extremes. The index remains above month-long upward trend line, which is positive. There have been no confirmed negative signals so far, however, we can see short-term overbought:
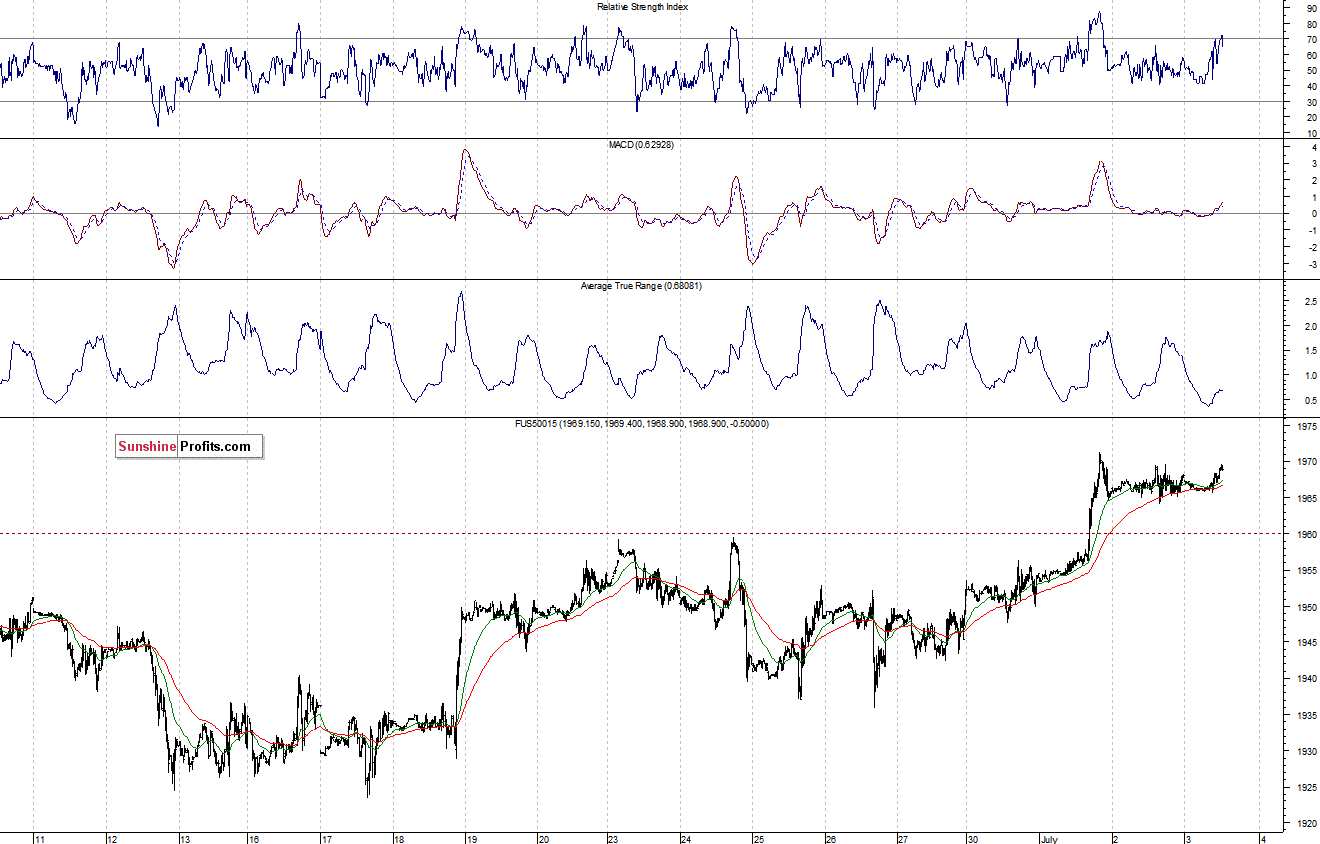
Expectations before the opening of today’s session are slightly positive, with index futures currently up 0.1-0.2%. The main European stock market indexes have gained 0.5-0.7% so far. Investors will now wait for series of economic data announcements: Nonfarm Payrolls, Unemployment Rate, Initial Claims, Trade Balance at 8:30 a.m., ISM Services at 10:00 a.m. The S&P 500 futures contract (CFD) trades close to its all-time high, as it continues to fluctuate along the level of 1,965-1,970. The nearest important support level is at around 1,960, as we can see on the 15-minute chart:
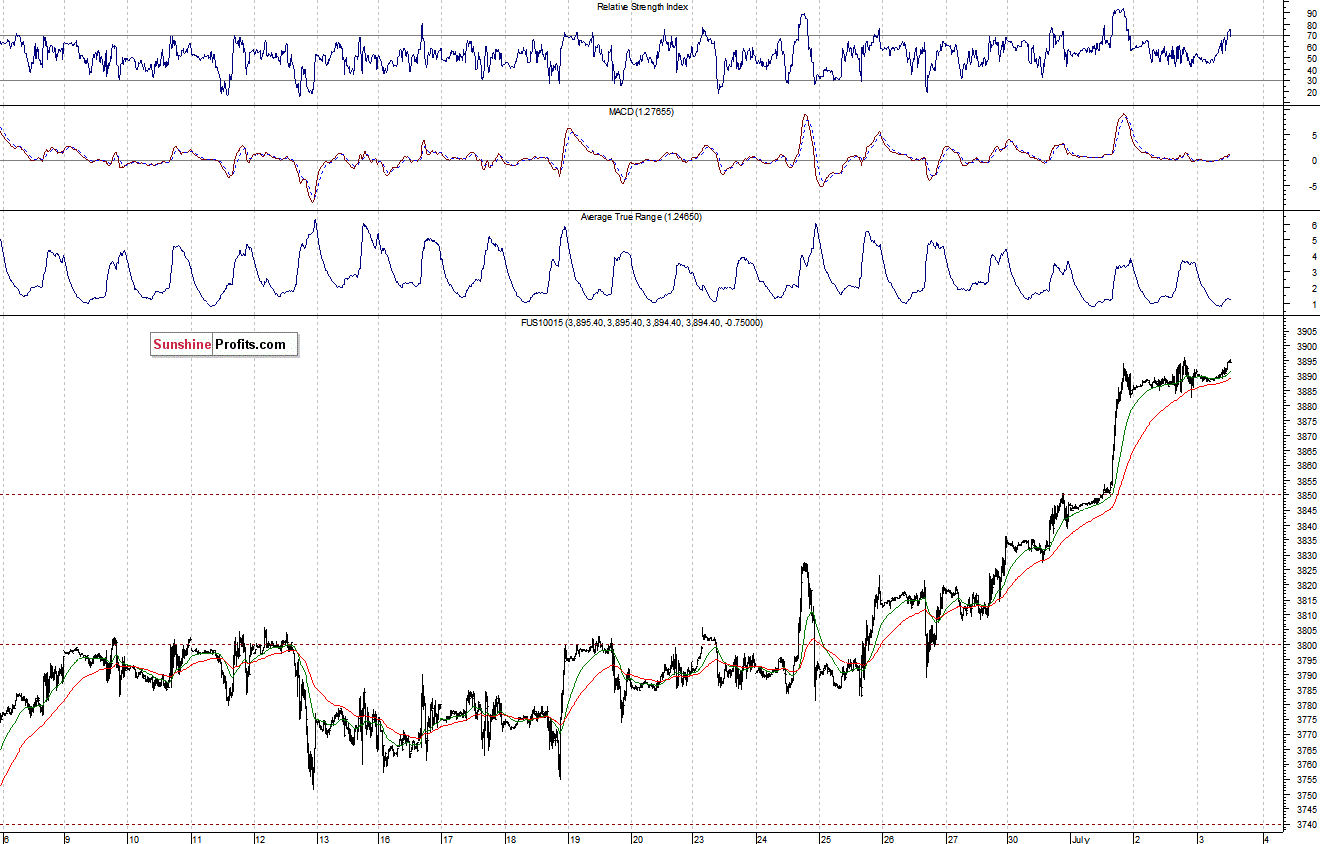
The technology Nasdaq 100 futures contract (CFD) is in an analogous consolidation, close to its long-term high. The resistance level is at the psychological 3,900. On the other hand, the level of support is at 3,880, marked by recent local lows, as the 15-minute chart shows:
Concluding, the broad stock market is in a short-term flat correction within an uptrend. There have been no negative signals so far, however, we can see some overbought conditions which may lead to a correction. We think that it is better to stay out of the market at this moment.
Thank you.
Paul Rejczak
Stock Trading Strategist
Stock Trading Alerts
