
Stock Trading Alert originally sent to subscribers on June 26, 2014, 6:55 AM.
Briefly: In our opinion, no speculative positions are justified.
Our intraday outlook remains neutral, and our short-term outlook is now neutral, following Tuesday’s intraday reversal:
Intraday
(next 24 hours) outlook: neutral
Short-term (next 1-2 weeks) outlook: neutral
Medium-term (next 1-3 months) outlook: neutral
Long-term outlook (next year): bullish
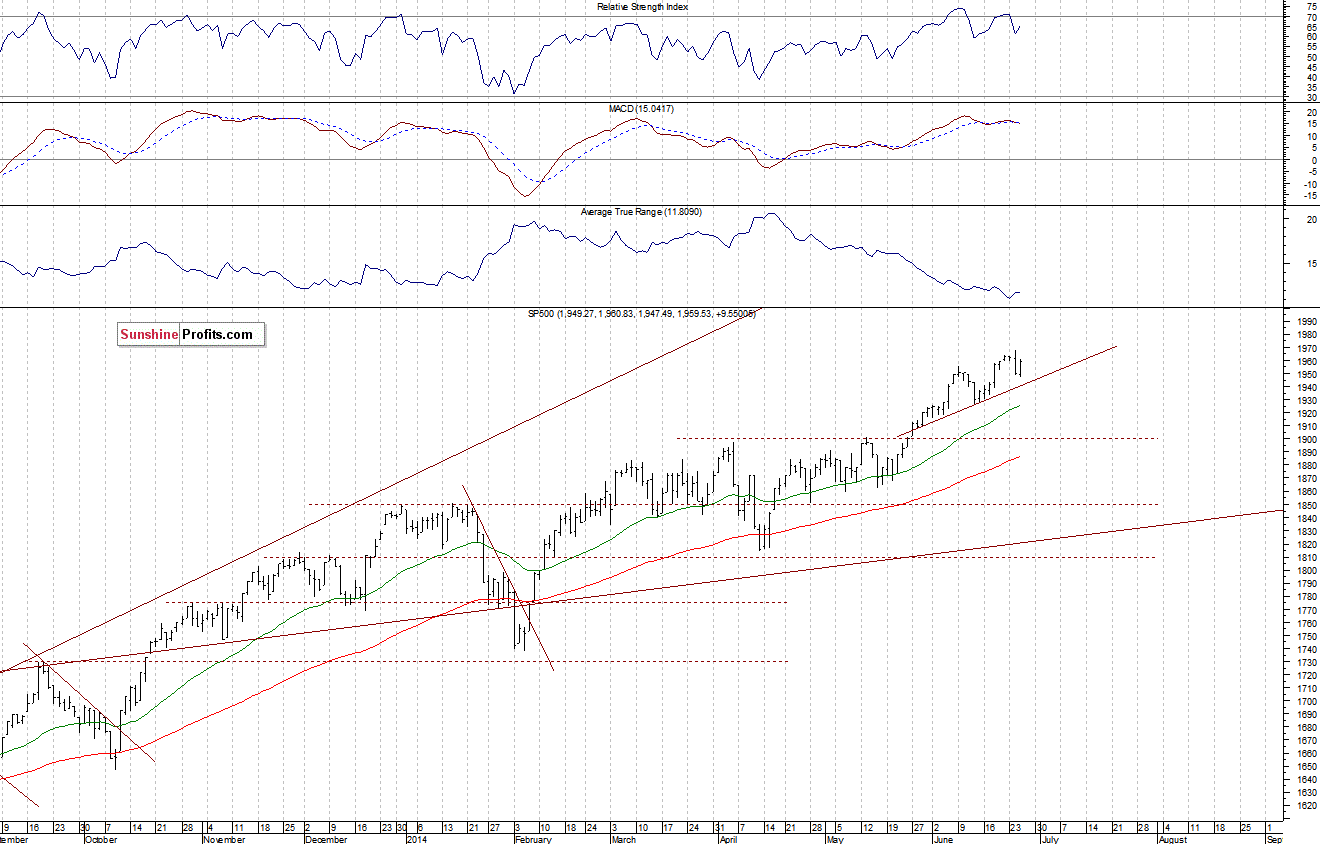
The U.S. stock market indexes gained between 0.3% and 0.7% on Wednesday, retracing Tuesday’s move down, as investors were buying stocks despite worse-than-expected GDP data release. So, our yesterday’s short-term neutral outlook has proved to be quite accurate (link). The S&P 500 index continues to fluctuate slightly below its recent all-time high of 1,968.17. The resistance level is at 1,960-1,970, and the nearest level of support is at 1,940-1,950. For now, it looks like a flat correction within an uptrend. There have been no confirmed sell signals so far. The market remains above its month-long upward trend line, as we can see on the daily chart:
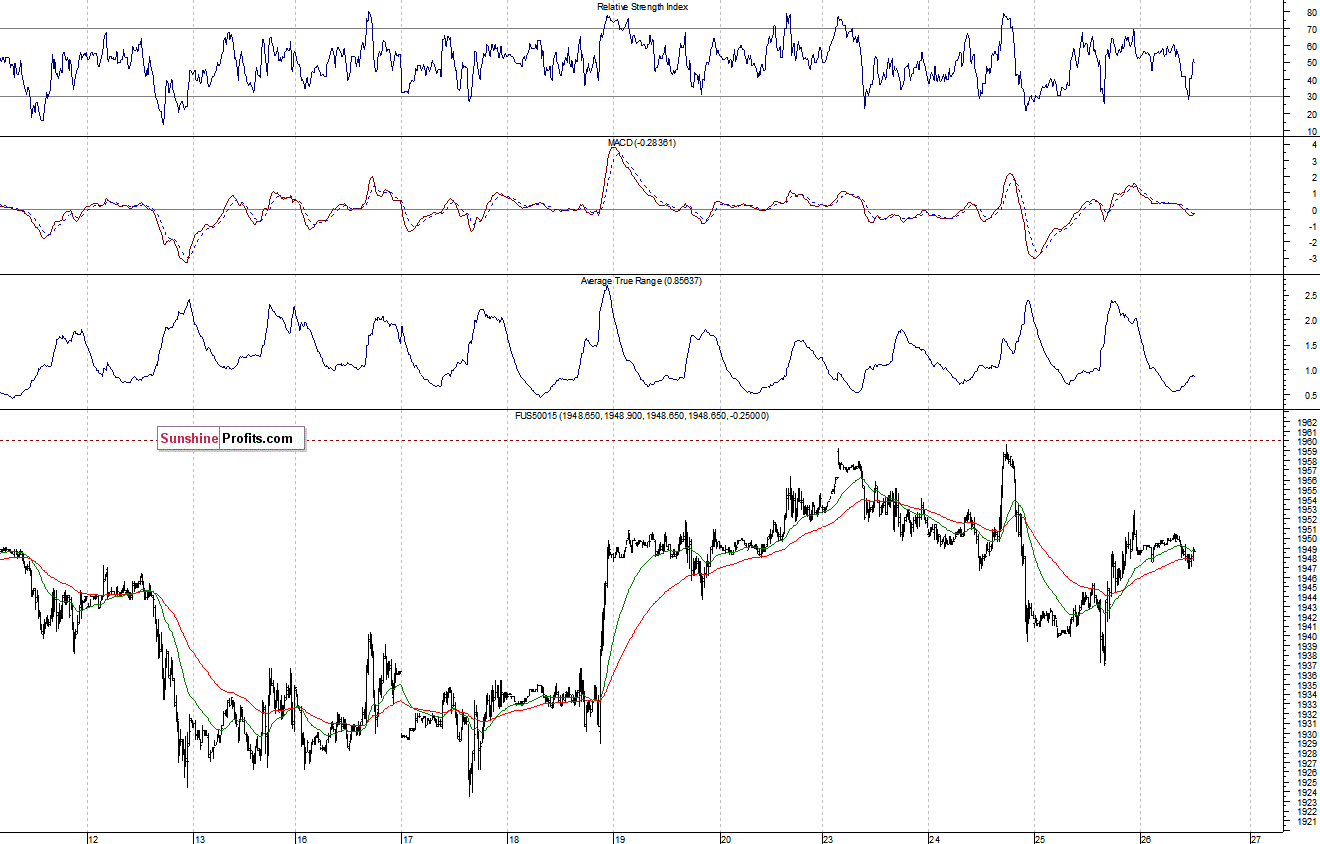
Expectations before the opening of today’s session are virtually flat and the main European stock market indexes have been mixed so far. Investors will now wait for some economic data announcements: Initial Claims, Personal Income, Personal Spending, PCE Prices – Core at 8:30 a.m. The S&P 500 futures contract (CFD) extends its short-term consolidation below the level of resistance at around 1,960. For now, it looks like a flat correction within long-term uptrend. The nearest support level is at 1,935-1,940, marked by previous local low, as the 15-minute chart shows:
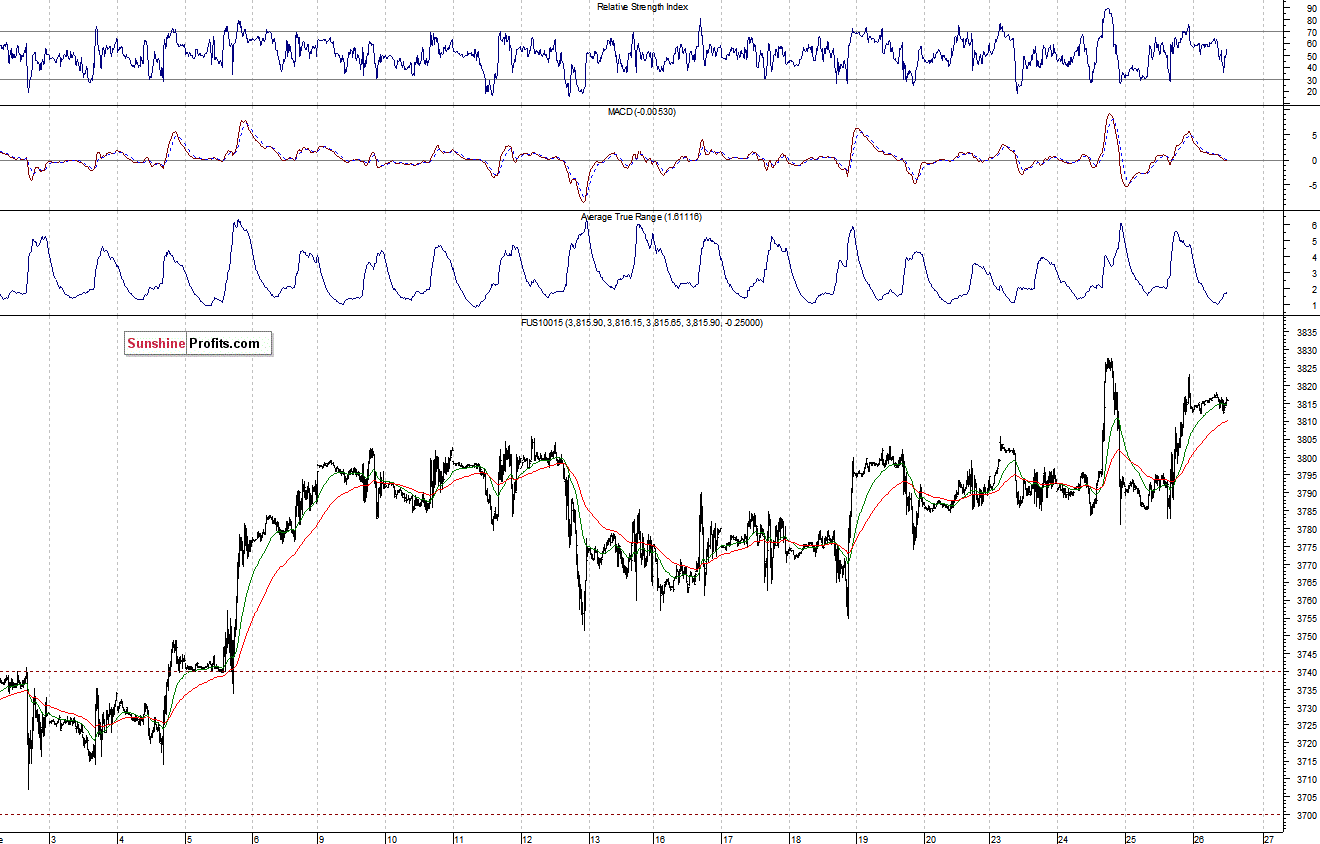
The technology Nasdaq 100 futures contract (CFD) is in a relatively narrow intraday trading range, as it is relatively stronger than the broad market. The resistance level is at 3,825-3,830, and the nearest important support level is at 3,790-3,800:
Concluding, the broad stock market appears to be in a short-term consolidation, fluctuating along the level of 1,950. We decided to close our speculative long position, expecting some more consolidation or a downward correction.
Thank you.
Paul Rejczak
Stock Trading Strategist
Stock Trading Alerts
