
Stock Trading Alert originally sent to subscribers on May 22, 2014, 7:12 AM.
Briefly: In our opinion speculative long positions are still favored (with stop-loss at 1,850, S&P 500 index).
Our intraday outlook is still bullish, and our short-term outlook remains neutral:
Intraday
(next 24 hours) outlook: bullish
Short-term (next 1-2 weeks) outlook: neutral
Medium-term (next 1-3 months) outlook: neutral
Long-term outlook (next year): bullish
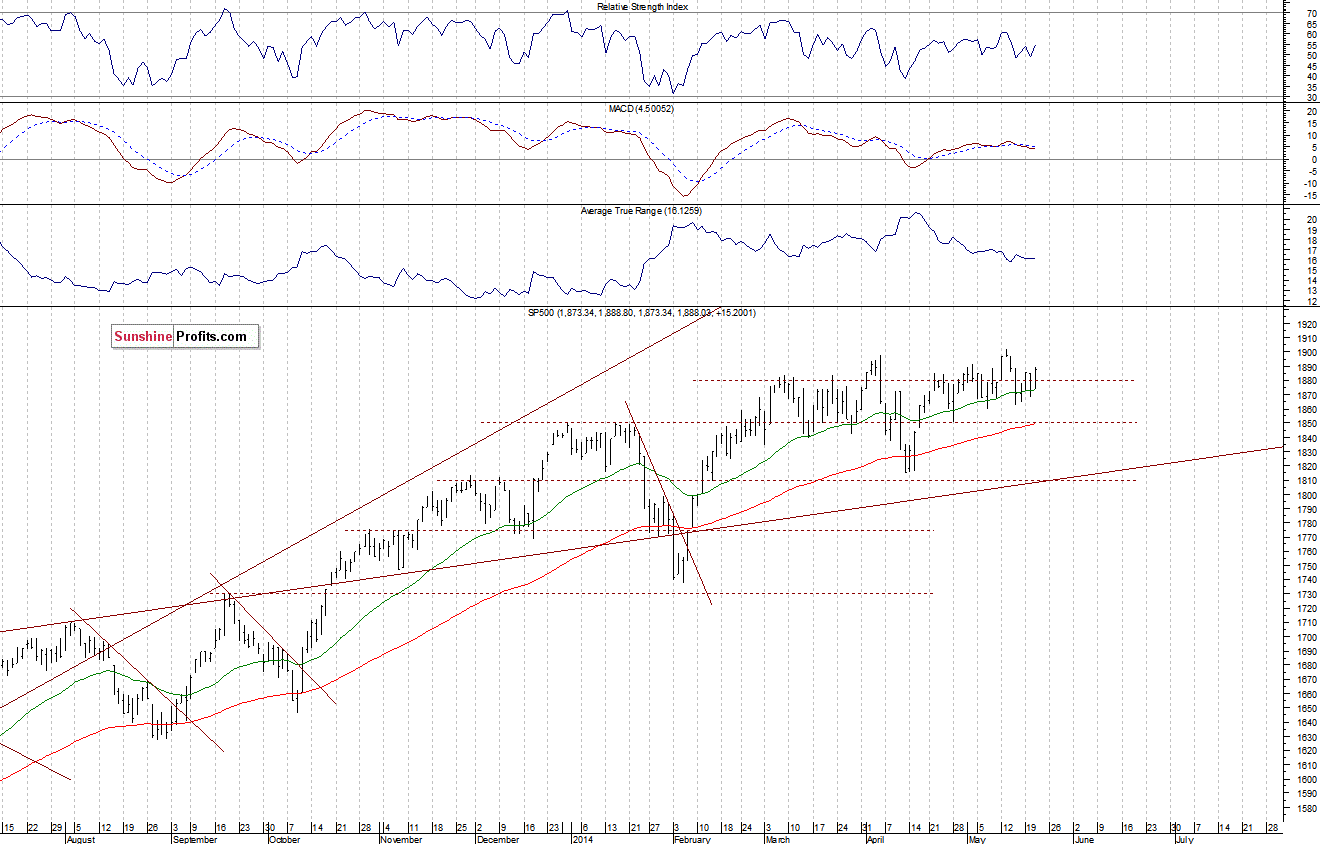
The main U.S. stock market indexes gained 0.8-1.0% yesterday, breaking above their recent consolidation, as investors’ sentiment improved following FOMC Minutes release, among others. The S&P 500 index remains slightly below its May 13 all-time high of 1,902.17. The resistance is at 1,880-1,900. On the other hand, the support level is at 1,860-1,865, and the next support is at 1,850. There have been no confirmed negative signals so far, however, there has been no clear breakout above medium-term consolidation neither:
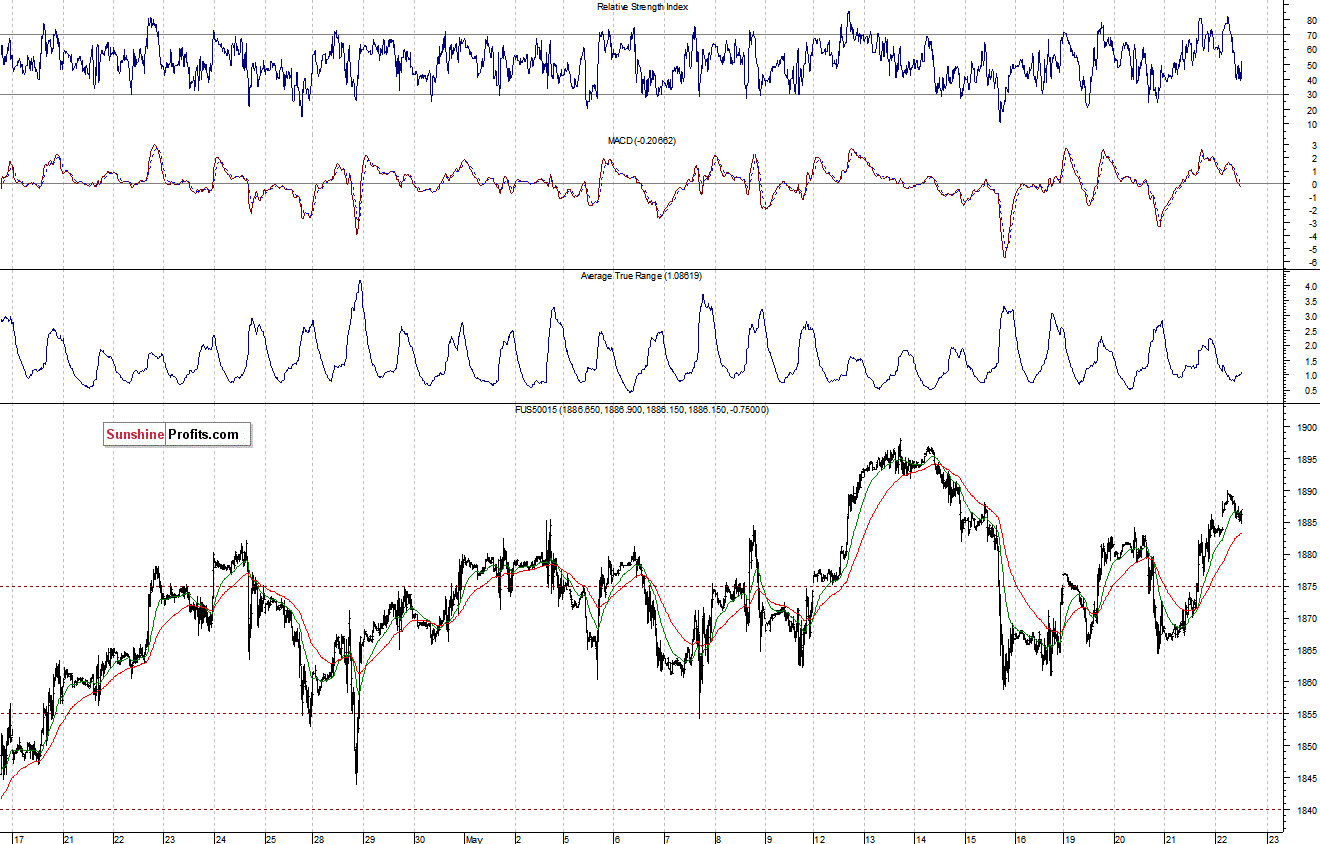
Expectations before the opening of today’s session are virtually flat, with index futures currently up 0.1%. The European stock market indexes have been mixed between -0.2% and +0.2% so far. Investors will now wait for some economic data announcements: Initial Claims at 8:30 a.m., Existing Home Sales, Leading Indicators at 10:00 a.m. The S&P 500 futures contract (CFD) trades slightly below last week’s highs, following yesterday’s move up. The resistance is at around 1,895-1,900, and the nearest important support level is at 1,880-1,885, marked by previous resistance, as we can see on the 15-minute chart:
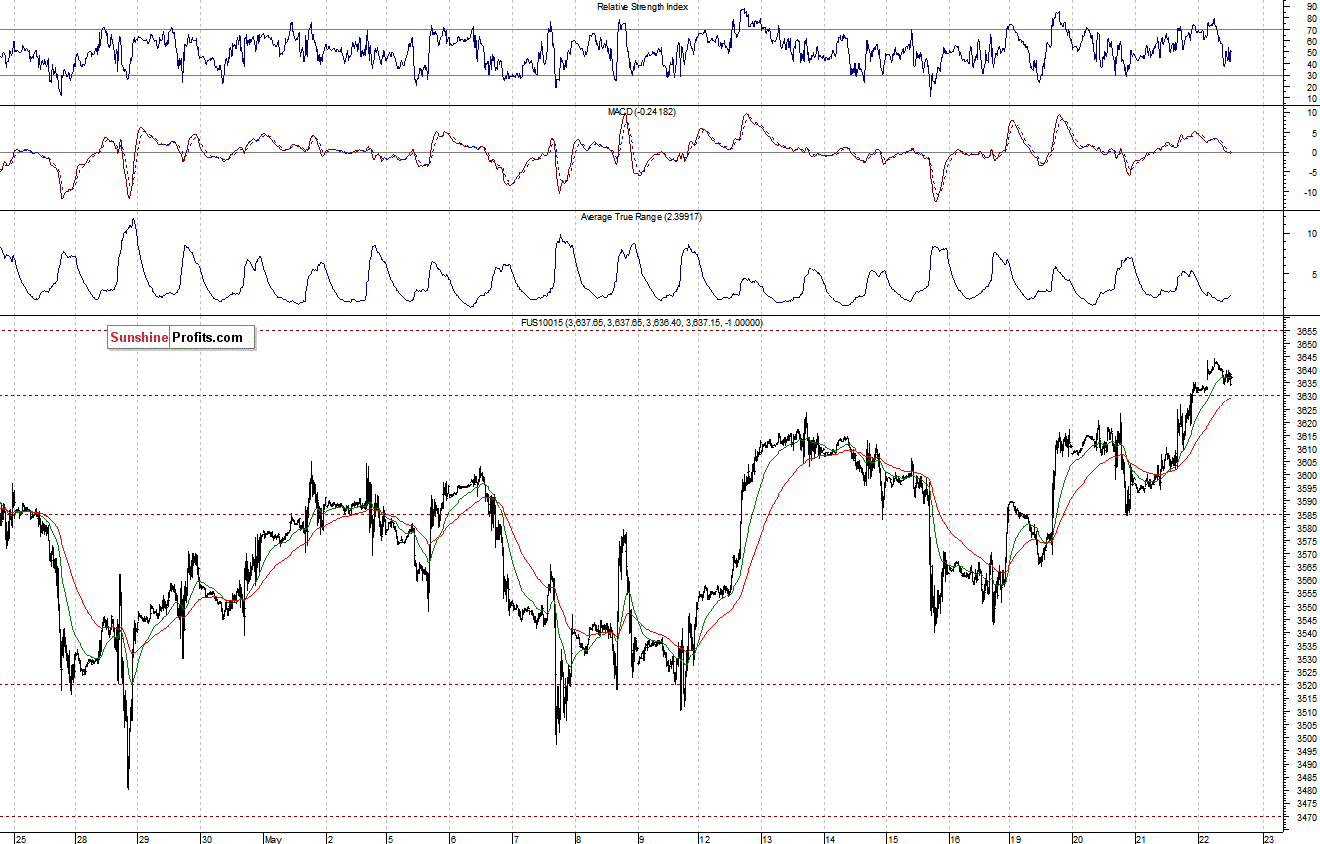
The technology Nasdaq 100 futures contract (CFD) continues its short-term uptrend, as it is above the resistance of 3,600-3,620. The nearest resistance is at 3,650-3,670, marked by some early April local highs. On the other hand, the nearest important support is at 3,600, marked by previous resistance, as the 15-minute chart shows:
Concluding, the broad stock market confirms our speculative long position (which is already profitable), as it approaches last week’s all-time high. Will it break above the resistance? It is hard to say. However, we are quite comfortable with our long position here, with stop-loss at 1,850 (S&P 500 index).
Thank you.
Paul Rejczak
Stock Trading Strategist
Stock Trading Alerts
