
Based on the October 11th, 2013 Premium Update. Visit our archives for more gold articles.
On Monday, after weekend talks failed to reach a solution that would reopen the federal government and raise the federal borrowing limit by October 17, the S&P 500 Index dropped to its intraday low below 1,700. However, the index reversed course early in the afternoon on a report that President Barack Obama planned to meet with Congressional leaders from both parties at the White House later in the afternoon.
According to Reuters, yesterday Senate leaders made progress on a U.S. debt deal. Additionally, today they may reach an agreement to bring a halt to the fiscal standoff. The emerging deal would avoid a potential default, end the 15-day-old government shutdown and change the immediate deadlines in favor of three new ones over the next four months.
Although it’s far from complete as the Senate may delay passing the plan and House Republicans may seek to block or change it, investors still believe that an extension to the debt ceiling, or at least a resolution that buys more time, is highly likely. So do we – no matter how the authorities decide to call it, we think that more money will be available. Printing it is just too easy politically.
Yesterday, the S&P 500 rose for a fourth day and closed at the highest level since September 19. It’s worth noting that the index is within 16 points of its September 18 record of 1,725.52. The S&P 500 has advanced 3.3% in the last four trading sessions and this is its biggest four-day rally since January.
The rally in stocks seems to have triggered a decline in the precious metals sector and the following stocks’ moves could further contribute to metals’ performance.
Will the stock indices keep rallying? Let's take a closer look at the charts to find out what the current situation in the general stock market is (charts courtesy of http://stockcharts.com).
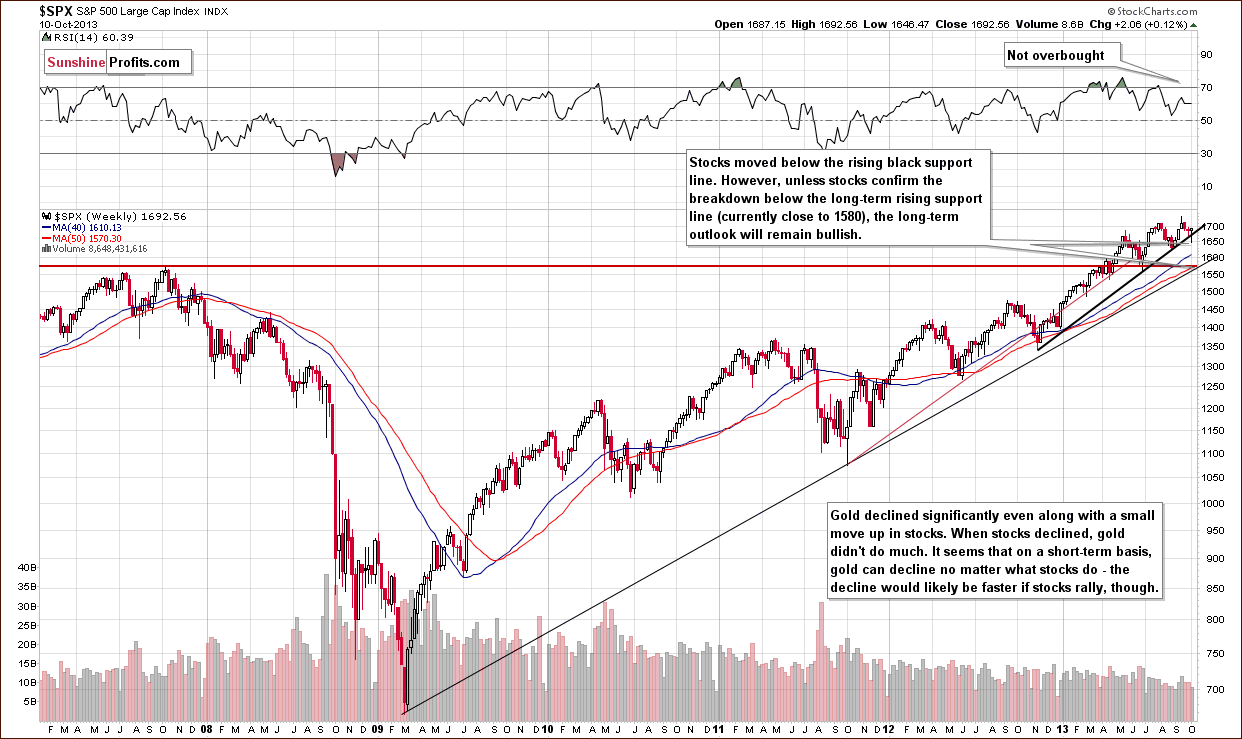
Looking at the above chart, we see that the move below the rising medium-term support line was quickly invalidated and the outlook improved dramatically based on Thursday’s session.
The official reason was “signs of progress in negotiations to raise the U.S. debt limit, at least temporarily.”
In our view, it’s almost certain that the debt ceiling will be raised, and the only unknown is the justification that politicians will use to do it this time. Therefore, we can expect stocks to rally further as the market becomes more optimistic about it. As mentioned earlier, yesterday the S&P 500 rose for a fourth day and closed at the highest level since September 19, which confirms the above assumption.
In the previous week, gold’s reaction was quite interesting – it didn’t rally even though the additional perceived probability of the increase in the debt limit should trigger such a move. This time, markets seem to have focused on this piece of information as a relief, and people sold gold, which is no longer needed as a hedge – at least a lot of investors seem to have thoughts like that.
The implications for gold are bearish, and this makes them bearish also for the rest of the precious metals sector, although to a smaller extent.
Let’s take a look at the short-term outlook.
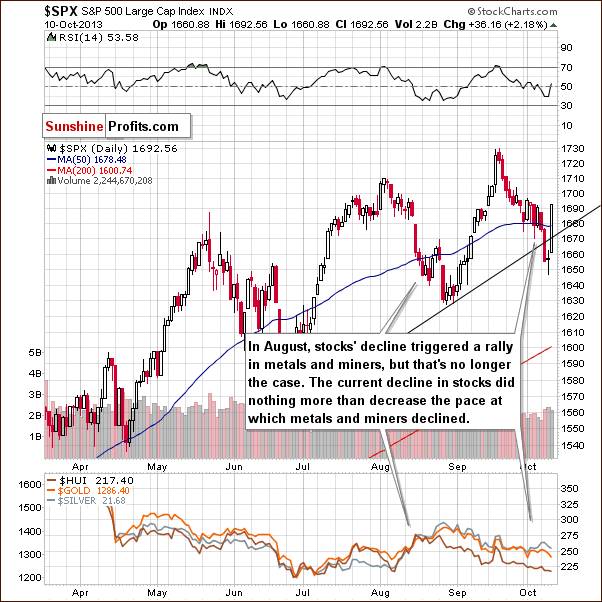
The invalidation of the breakdown is quite clear on the above chart, but since we already covered it above, we will now focus on something else.
Another important thing to be noticed here is that declining stock prices didn’t trigger a rally in the precious metal market. The only way in which the declining stocks managed to impact the precious metal market was to decrease the pace of the metals’ and miners’ decline. On a side note, our Stock Trading Alert subscribers remained updated throughout Thursday’s volatile session (4 alerts were published on Thursday; the first one is available publicly and its description in the list of alerts is accompanied by an arrow summarizing the outlook – it was green and pointing upward before Thursday’s session – for the first time in a week and a half).
Let’s turn now to the financial sector, which in the past used to lead the rest of the general stock market.
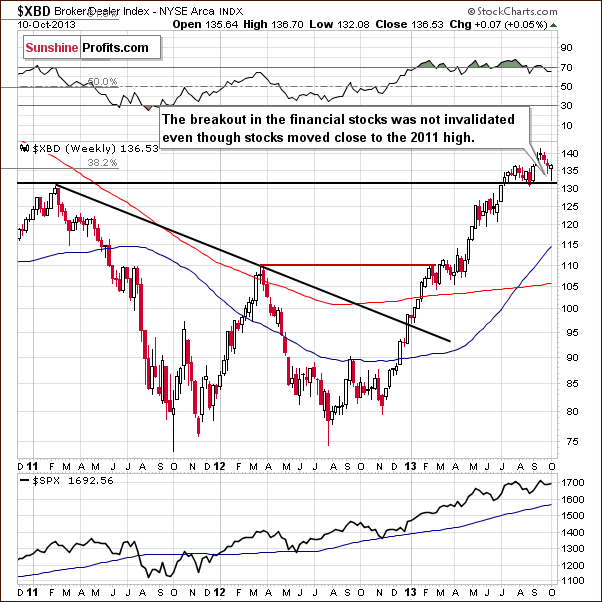
On the above chart we clearly see that, in spite of the recent downward move, the financial stocks didn’t invalidate the breakout above the level of 130. This was a subtle indication that a bigger decline would not be seen on the stock market.
Consequently, the medium-term outlook remains bullish. Please note that since the support created by the 2011 high is relatively close, we will likely not see another major decline.
With a bullish outlook for the stock market, it seems that the decline in the precious metals stock market can continue in the medium term.
But how are stocks performing relative to gold – particularly: gold stocks? Let’s move on to the gold stocks:gold ratio. We think that this is another interesting chart that may provide important clues about further movements in the precious metals.
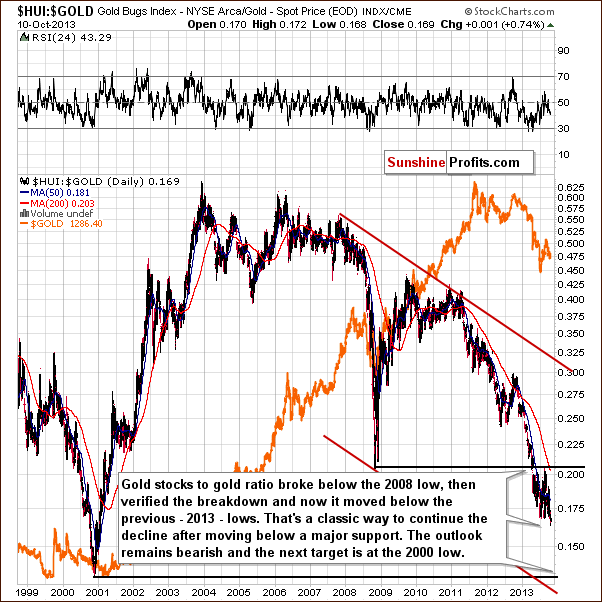
At the beginning of the previous week the HUI:gold ratio declined sharply and moved visibly below its 2013 lows. In other words, we saw a major breakdown in this important ratio and it seems that the ratio is on its way to the 2000 low at 0.133.
Please note that the significant underperformance of the ratio was the thing that preceded the April plunge earlier this year. Of course, it doesn’t mean that metals or miners have to move lower immediately, but in our view, it’s just a matter of time.
Summing up, the long-term, medium-term and short-term outlooks for the stock market are bullish, and the implications for the precious metals sector are bearish.
-----
Gold declined more than $20 today and silver declined more than 50 cents only to pull back with vengeance - both markets are now above their yesterday's highs. Generally, metals are moving lower - taking the medium term into account, but the short-term price swings can be very wide. Just because one knows that the markets will move lower before they move to new highs, doesn't mean that it's easy to establish a trading position and then keep it as long as it makes sense (where should I place a stop-loss orders?).
Given the above, it's not easy to profit on the medium-term move - at what price should you enter the market? How big should the position be? Is the outlook bearish enough to get out of the precious metals market completely? We can assist you in that and this help should be particularly useful given the current volatility (and given that the volatility will likely increase shortly). The best way to approach a difficult market is to be prepared in advance and to stay informed at all times and that's what you can get thanks to our Market Alerts and Premium Updates. You can sign up for them using this link.
Thank you.
Przemyslaw Radomski, CFA
Back