
Visit our archives for more gold & silver articles.
Many metaphors have been used for gold but never to our knowledge has the price of gold been compared to the non-barking dog. (This refers to the Sherlock Holmes story, Silver Blaze and the "curious incident of the dog in the night-time." Holmes infers that the dog made no noise because the villain was someone the dog knew very well.)
In a Financial Times piece this week the writer, Peter Tasker, said that “Just like the non-barking dog in the Sherlock Holmes story, the gold price has become strangely insensitive to the usual stimuli.”
In other words, the Eurozone, the slowdown in the U.S. and China and bank scandals coming to light weekly no longer cause the dog (gold) to bark (go up.)
“Unsurprisingly, investors are running scared. The global flight to safety has seen capital flood into "core" sovereign bond markets, driving yields down almost to vanishing point. Yet, despite this perfect storm of financial instability, the gold price remains becalmed. In fact, over the past year gold bullion has behaved like a "risk on" asset, rising and falling in sync with stock markets.”
Tasker says that although for most of human history gold has played the role of a "store of value," now those days are long gone. “Gold has become just another financial asset, as vulnerable to the shifts of investor sentiment as an emerging market.”
He asks “why has the golden dog suddenly gone silent?” and answers that “One likely reason is that the price has simply become too rich.”
He cites the website pricedingold.com, according to which gold is at a 120-year high relative to US house prices. “Likewise, it is at a 74-year high relative to US wages, at multi-generation highs relative to wheat, coffee and cocoa and at the same price relative to the cost of a Yale education as in the first decade of the 20th century.”
Tasker suggests that “for those who are nervous of financial markets, there exists an obvious alternative. On the pricedingold.com numbers, you should cash out of gold, buy a nice house, hire some workers, send your kids to college and eat big breakfasts.”
We agree with the big breakfast part as we enjoy such ourselves, but we don’t agree with putting all of the cash out of gold part, at least not yet (we do believe, however, that being partly out, or – better – hedging part of one’s gold holdings is a good idea). The gold bull market still has a long way to go.
Looking forward, the Fed may provide yet another round of quantitative easing which would most likely have a short-term negative impact on the U.S. dollar and a positive impact on the price of gold. Just how much is difficult to predict. In any case, we believe that investors need to hold some gold in their portfolio both for diversification as well as protection against more turbulent times and as a store of value. Ahead we still face the threats of a euro break-up, a slowdown in China and the “fiscal cliff” at the end of the year, a frightful combination of tax increases and spending cuts unless Congress acts to stop them.
If nothing else, gold has proven itself for maintaining its purchasing power relative to prices in general over time, which is the point that Tasker misses when he suggests that you cash completely out. That is more important than the ultimate price of gold itself. Even he makes the point in that gold is at a high relative to U.S. housing, commodity prices and has maintained its value vis a vis a Yale University education for the past 100 years. Keep the gold in your portfolio and it may help send your great-grandchildren to Yale.
However, we would like to stress that on a medium-term basis, all the above-mentioned relative valuations do indeed paint a bearish picture. If the medium-term decline comes, we will view it as a great opportunity to re-enter the market at lower prices, not as an end of the whole bull market in the precious metals.
Gold has been much in the news this past week, but mostly in the Olympic Games taking place in London. So has been silver and, what is more, there has been one bullish signal in the sea of bearish ones, that we believe deserves some attention, as it may be over-interpreted. Hence today’s technical portion is dedicated entirely to the white metal. We will start with the long-term chart (charts courtesy by http://stockcharts.com.)
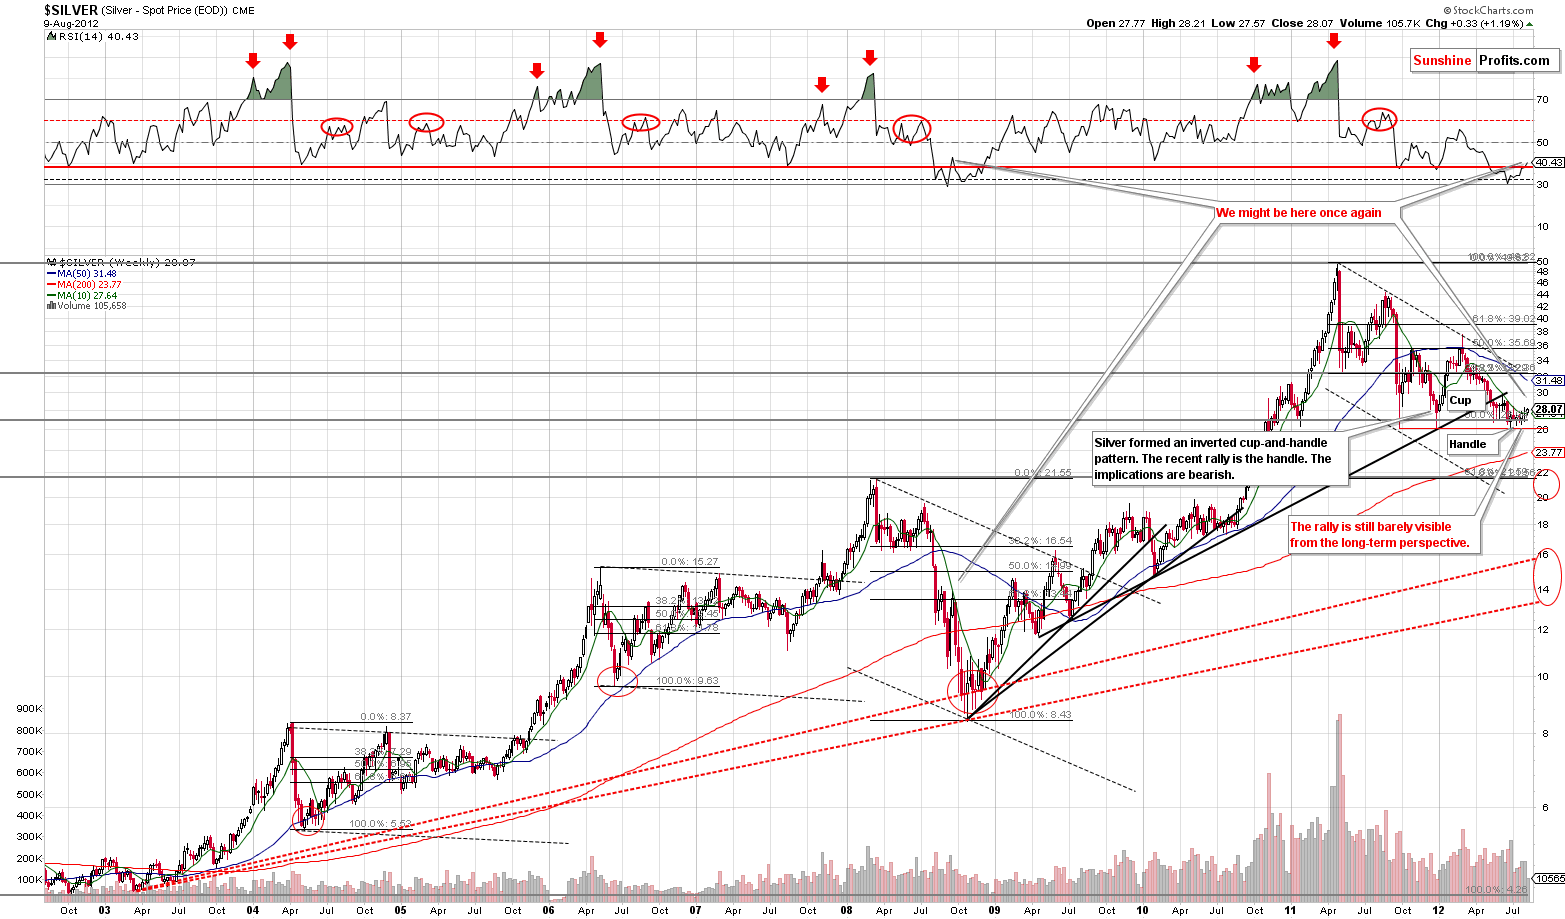
In the very long-term chart for silver (if you are reading this essay on sunshineprofits.com, you may click the above chart to enlarge) the RSI moves (in the upper part of the chart) to the upside this week very much resemble the price action seen in 2008.
So this might just be where we are right now. Silver’s price moved above the 10-week or 50-day moving average but this does not invalidate the inverted cup and handle pattern. By itself, such a move (even though clearly bullish) does not change the overall picture for the precious metals sector since there is no accompanying confirmation by a medium-term breakout in gold nor mining stocks. Hence, we would like to stress the fact that making an investment decision based on such a signal alone would probably not be a good idea.
Let us now have a look at a chart that shows the performance of the white metal relative to the yellow one, that may serve as another warning against overconfidence in silver’s future performance.
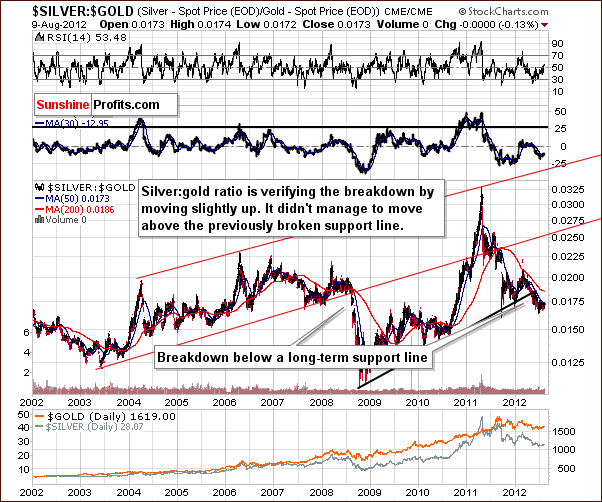
In the silver to gold ratio chart, there is no improvement at all this week. The trend remains down in this chart, meaning that silver appears likely to under perform gold in the weeks ahead. A breakdown has been seen and further weakness appears likely from here.
Summing up, there are virtually no positive signs for the white metal in this week’s chart except for the move above the 50-day moving average. This move was not accompanied by analogous breakouts in gold nor mining stocks, so we don’t view it as overly important. The silver-to-gold ratio indicates further weakness ahead.
To make sure that you are notified once the new features are implemented, and get immediate access to my free thoughts on the market, including information not available publicly, we urge you to sign up for our free e-mail list. Sign up for our gold & silver mailing list today and you'll also get free, 7-day access to the Premium Sections on my website, including valuable tools and charts dedicated to serious PM Investors and Speculators. It's free and you may unsubscribe at any time.
Thank you for reading. Have a great weekend and profitable week!
P. Radomski
--
Miners moved higher yesterday, but the move was accompanied by low volume. This is generally a bearish sign, but is this the case right now? After all, mining stocks moved higher despite the fact that the USD Index moved higher as well this week. Which of these factors is less relevant and why are two of the questions that we reply to in today's Premium Update.
Gold rallied but has anything changed yet? Have seen any important breakouts? As always, we analyze the most important markets and ratios in order to answer these questions - both: popular and uncommon ones. The cyclical nature of silver and the USD Index provides us with additional insight.
In the last ten years, every time the gold price has sat around doing nothing for about a year, it has subsequently gained on average 33% the following year. In today's issue we explain if this statistic has important bullish implications today. We summarize our analysis by providing target prices for gold, silver and mining stocks as well as our estimate of next move's probability of materializing.
We encourage you to Subscribe to the Premium Service today and read the full version of this week's analysis right away.
