
Visit our archives for more gold & silver articles.
Before making any investment decision it's usually good to look at the situation from different perspectives and make sure that the action that you are about to take is really justified. In fact, the same is the case with any other decision as well. In the precious metals market the analysis of gold is usually supplemented by the analysis of silver and gold stocks. At times, analysts focus on other markets that often influence metals: currencies and the general stock market. Some look for hidden details in the analysis of ratios and at times they look at even less popular charts (on a side note, just because something is not popular doesn't mean that it's less relevant for the analysis).
Today's essay will feature two parts of the precious metals market that are covered relatively rarely: palladium and silver stocks. We will compare their performance and explain what each of them currently tells us.
Let's start with palladium (charts courtesy by stockcharts.com.)
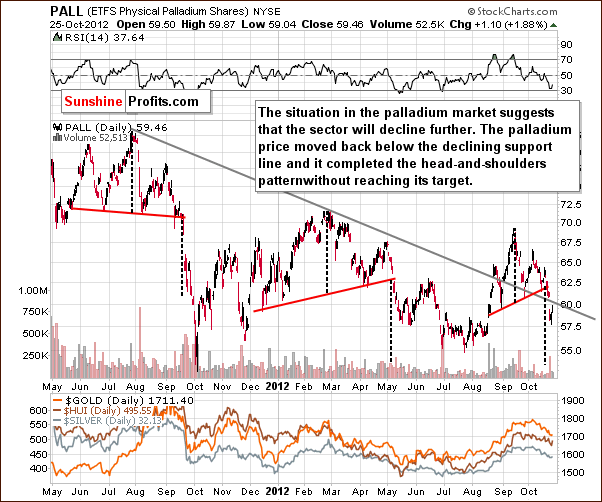
On the above chart, we see further bearish indications that declines in precious metals prices are not yet over. A head-and-shoulders pattern completed here recently but palladium (PALL) has not moved close to its target level yet. Target levels are based upon the size of the head in the pattern and these patterns are usually quite reliable for this metal (as opposed to what we see on the silver market where significant head-and-shoulder patterns are practically nonexistent).
The implications here are bearish for the whole precious metals sector. Will this really translate into lower prices for mining stocks as well as metals?
We have already written that precious metals mining stocks may outperform the underlying metals in the weeks to come. Now we would like to analyze a chart that has never been included in our free essays before and that further reinforces our previous comments in this matter.
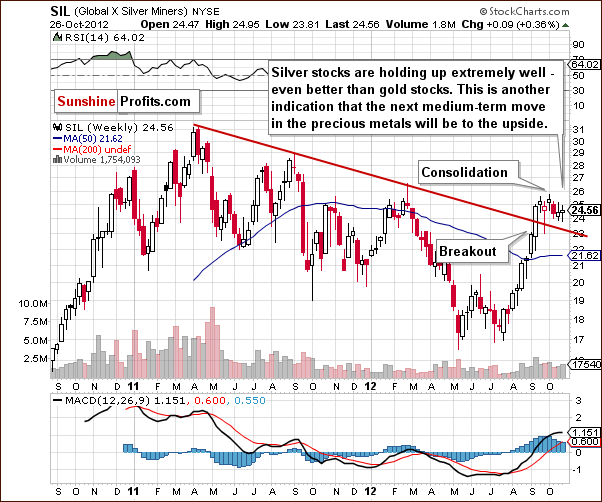
The above-mentioned, new chart is the long-term Global X Silver Miners chart, an ETF (SIL) that resembles an index of and hence it provides an insight into this sector as a whole. The silver stocks should provide confirmation or invalidation of points made in our earlier analysis of the palladium price. At this time, the silver stocks have a more bullish picture than any other part of the precious metal sector. The October 2012 correction is barely visible – actually, some sideways trading has been seen when silver declined, not a decline.
There really hasn't been a decline to speak of when compared to the moves to the downside for platinum, gold stocks and silver itself. Indications coming from volume are very strong as well, with higher prices accompanied by high volume and declines seen on low volume. All-in-all, the situation is very favorable for silver stocks and the rest of the precious metals with respect to the medium and long term –based on the above chart alone. This chart does not provide any short-term indications, though – at least we didn't find any meaningful short-term signs.
Summing up, the implications of the palladium chart for the whole precious metals sector are rather bearish for the short term, as the chart indicates that the current correction is not over yet. We have also seen a confirmation of the strength of the precious metals mining stocks. It seems that silver stocks will outperform precious metals and other miners in the future.
The correction in metals may not be over yet, but it looks like it’s over in case of the mining stocks, at least in terms of price.
Please keep in mind that if you are interested in short-term signals for gold, silver and mining stocks, then you can monitor our in-house developed indicators free of charge - there's a 5-trading-day delay, but even this version should be profitable for you. Actually, some indicators are followed by rallies that really pick up after a few days after a signal is seen and then continue for a few more weeks - so there's still time to take advantage of the signal and make some quick profits. Please feel free to examine the expected performance of gold, silver and mining stocks after each of the signals is seen in the details & performance section.
Thank you for reading. Have a great weekend and profitable week!
Przemyslaw Radomski, CFA
Back