
This essay is based on the Premium Update posted September 26th, 2009. Visit our archives for more gold & silver articles.
This week we have seen gold and silver move lower, just like I mentioned a week ago. Gold closed the week below $1000, and silver topped exactly in tune with the cycles that I mentioned in the previous essay. Where do we go from here and how fast? Let's take a closer look on charts (courtesy of http://stockcharts.com) and see what may be waiting just around the corner.
Gold
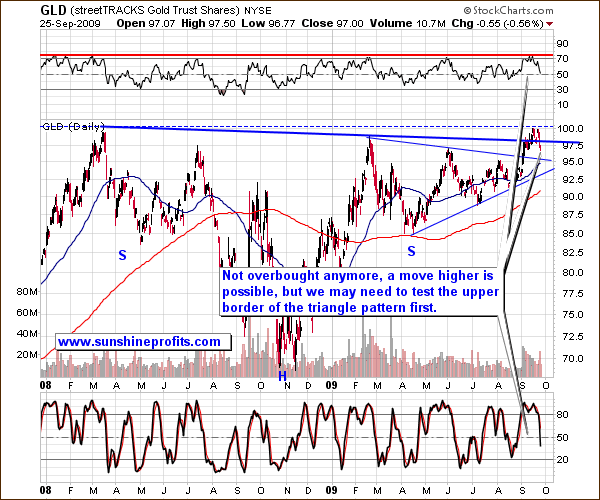
The long-term chart confirms what I wrote last week - that gold rose a little too fast for the rally to be sustainable. Consequently, we have now entered a consolidation phase. For now, it does not seem that gold will spend much time correcting the preceding move. It has closed several days above the long-term trend line (blue thick line on the chart above), so the breakout above it has been confirmed.
The price of gold failed to move above the 2008 high so far, but once we go above it, we shall see some real action in this market, especially considering the high volume that accompanied the beginning of this rally. Things look promising, because every barrier below the 2008 has already been taken out. Anyway, a move lower to the upper border of the previously mentioned triangle pattern is not out of the question in the short term.
The final outcome of this situation depends on how situation develops on other markets, with the USD Index being the most important one at this point. I will get back to this market later in this essay, but for now let's take a look at gold's little brother - silver.
Silver
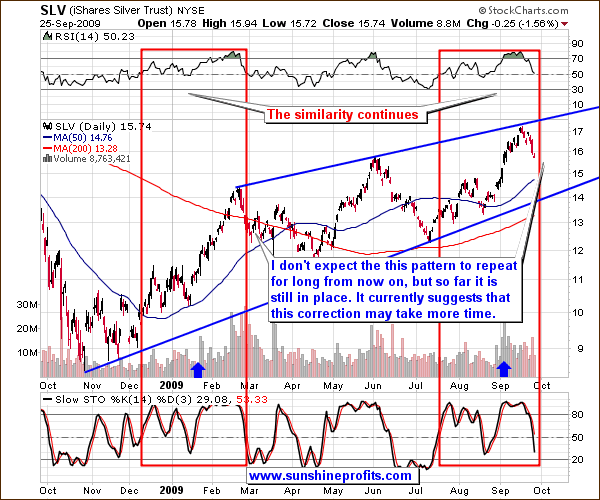
When I first mentioned the remarkable self-similarity in the silver market (red rectangles on the chart above), I knew that the pattern is an important factor when estimating the future performance of silver for the next several days at least, but it turned out that the Jan-Feb performance was a perfect roadmap for the whole September rally. This outstanding similarity has been a great indicator so far, but it virtually has to become less reliable in the future, as history doesn't repeat in every detail at all times - it "rhymes".
The current situation on the gold market suggests that the irregular (in terms of the ongoing self-similarity) is likely to surprise us positively. When gold breaks up through the 2008 high and verifies the breakout I expect silver to move quickly higher, even if the pattern suggests further consolidation. Still, for now it seems that silver may need to go a lower before resuming its upward trend.
Before I proceed with analyzing the U.S. Dollar, as one of the key factors determining short- and also long-term price swings of the precious metals, please take a look at the performance of PM stocks relative to the general stock market.
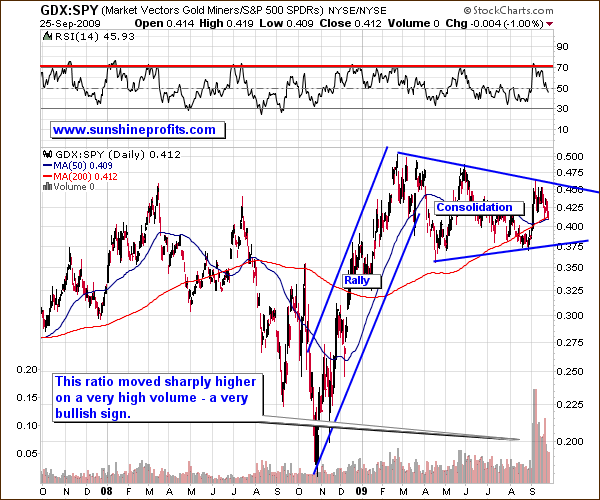
What we see above is a long consolidation after huge rally. This is really encouraging from the long-term point of view, as the rally that follows such a consolidation is often similar in size to the move that preceded it. If PM stocks manage to break out soon, we could see some real fireworks in the sector, for instance the GDX would equal the value of the SPY ETF. I realize that unless general stock market plunges, this means HUI above 800, but this is what the above chart suggests, and what I expect to take place sooner or later.
USD Index
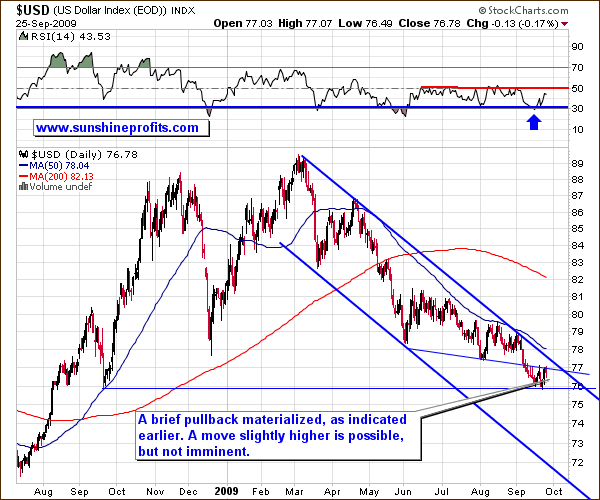
The USD Index is currently correcting the September downswing, and it might have already completed it, though this is not the most probable outcome in my view. There are several factors that make me think that we may move a little higher - above 77 but not higher than the 78 level.
The declining trend line (thick blue line) provides a solid resistance right now, and it has not been reached yet. Moreover, the breakdown below December 2009 low has not been verified yet, and a brief move higher from here would verify it. Last, but not the least, the RSI Indicator is not yet at the 50 level, and it was the level that meant the end of a correction in the past few months.
Summary
The analysis of the USD Index suggests that it is likely to move a little higher from here, which would mean exactly the opposite action in the PM sector. In my view, the two most likely scenarios at this point are: gold (along with silver and mining stocks) goes a bit lower to the upper border of the triangle pattern, or gold moves higher right away. The outcome depends to a huge extent on the dollar and the way PMs react to weakness in the main stock indices. The first factor is favorable in the medium-term, but suggests caution in the short run, and as far as the second one is concerned, it is still too early to make any calls. I will let my Subscribers know, once we have more information. For now, I believe that we will see PMs reach new highs in 2009.
To make sure that you get immediate access to my thoughts on the market, including information not available publicly, I urge you to sign up for my free e-mail list. Sign up today and you'll also get free, 7-day access to the Premium Sections on my website, including valuable tools and charts dedicated to serious PM Investors and Speculators. It's free and you may unsubscribe at any time.
Save time and money, by using our Premium Service! It saves you a great deal of time, as a large part of the analysis will be done for you. You pull the final strings, but you get a Premium version of our Updates, Alerts, Charts and Tools, which are bound to shorten the time that you need to make your investment- and speculation-related decisions. Saving time means saving money, and additionally - how much did you save by not selling at the beginning of September (recall that you received a free alert from me, in which I recommended holding your positions at that time) and by selling last week? Join our savvy Subscribers and take advantage of the full version of the exclusive, premium commentary.
P. Radomski
--
This week's Premium commentary includes a follow-up analysis of cycles on the silver market, which last week provided a crystal-clear top signal, short-term gold chart, and more. Commitment of Traders report suggests that precious metals are likely to plunge is this really the case here? This week' Premium Update puts the CoT report into bigger perspective as I elaborate on the consequences for Gold and Silver Investors.
