
This essay is based on the Premium Update posted September 19th, 2009. Visit our archives for more gold & silver articles.
This week the price of gold hovered above the $1000 level and managed to close above this important level, a very significant and optimistic development for anyone interested in the precious metals sector. But before we launch into euphoria and speed away, now might be a good time to look back into our rearview mirror.
While we're looking back, here is some interesting research to put things into historical perspective. Back in November, a researcher by the name of James Bianco crunched the numbers adjusted them to inflation and discovered that the government bailout cost more than - are you ready for this? - the Marshall Plan, the Louisiana Purchase, the race to the moon, the S&L crises, the Korean War, The New Deal, the invasion of Iraq, the Vietnam War and NASA combined.
The only single American event in history that even comes close to matching the cost of the credit crisis ($4.6 trillion) is World War II: Original Cost: $288 billion, Inflation Adjusted Cost: $3.6 trillion.
Keeping in mind that inflation is the increase in the prices of goods caused by the changes in the money supply, expecting high inflation in the coming months and years looks like a sure bet.
Now let's take a look at how gold - generally known as the best inflation hedge - has fared in this turbulent year. On September 19th , a year ago, the price of gold was $865. Over the past year gold proved to be an excellent hedge at times of economic distress, and bounced with a vengeance after dropping, along with virtually every other asset, due to margin calls. Contrary to the general stock market, gold is now much higher (and about to reach new highs) than it was back then. This fact is encouraging by itself. Combining it with positive fundamentals provides us with an even more bullish outlook. The only thing the PMs need to move substantially higher is a very favorable technical juncture. Are we there? Let's turn to charts (courtesy of http://stockcharts.com) for clues.
Gold
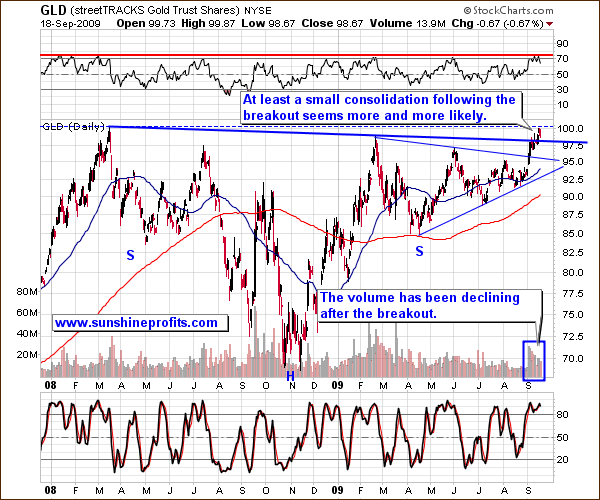
From the long-term point of view, gold is in a favorable situation, as it closed above the $1000 level during the last 4 trading days, confirming the move above that barrier. It hasn't yet pierced through the 2008 high, but I believe it's just a question of time, and in the not too distant future, before we see the yellow metal break higher.
The RSI Indicator was just at the overbought levels and is still near 70, which in the past was an efficient tool in timing local tops, so the odds of a decline from here are rather high.
Volume has been declining after price moved sharply higher, generally a sign that a rally's end is near. In this case I think a consolidation is the most likely outcome. Should consolidation indeed materialize, I expect the downswing to be stopped by either the horizontal blue line, just below Friday's close, or to the declining upper border of the previous triangle pattern - marked on the chart with thin, blue line. In other words, if it corrects, most likely gold will not go lower than $970.
Silver
Gold's volatile brother has been rallying strongly in the past several weeks, yet one must remember that no asset moves straight up or down.
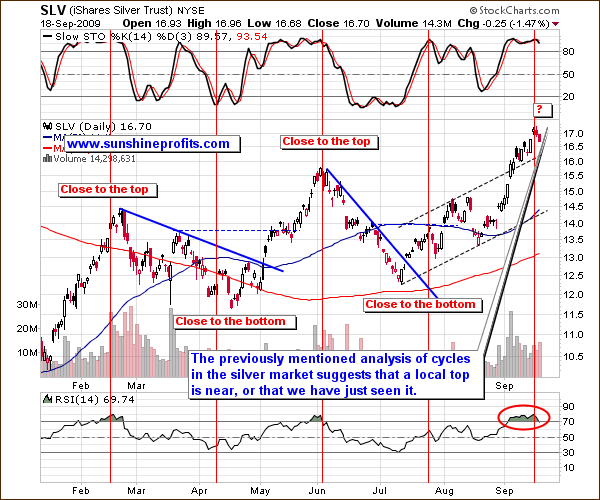
In the middle of August I mentioned a particularly interesting cycle visible in the silver market, which can be a profitable addition to one's trading tools. While it is not a crystal ball, especially with bottoms, the red vertical lines provide us with a somewhat reliable indication of when a market turning point may emerge. Back in August I used this analysis to show you that the rally is just beginning (which, happily, was the case), as the price of silver was trading close to the "bottom vertical line", not the "top" one.
The reason I'm returning to this analysis this week is that silver has just moved past the "topping line", meaning that we can expect a local top. We have indeed seen an immediate-term top on the exact day that this line signaled it, but it is not yet sure whether or not price will move higher once more before taking a breather. With the RSI at the overbought levels and going lower, it seems that they top may be in. Still, taking the size of the preceding rally into account, one may want to wait for additional confirmation before closing one's long positions - for instance a daily upswing on a very low volume. The more short-term oriented you are, the more I would suggest closing your long position in silver.
Summary
Gold managed to close above the $1000 level for 4 consecutive days, and also for the second week - very positive developments from the long-term point of view. On the other hand, it seems to be overbought in the short term and vulnerable to a decline or a consolidation. The same can be said about silver. If gold (and corresponding markets) moves lower, it is probable (no guarantees, of course) that it would hold above the $970 level. Gold managed to close above the $1000 level for 4 consecutive days, and also for the second week - very positive developments from the long-term point of view. On the other hand, it seems to be overbought in the short term and vulnerable to a decline or a consolidation. The same can be said about silver. If gold (and corresponding markets) moves lower, it is probable (no guarantees, of course) that it would hold above the $970 level.
To make sure that you get immediate access to my thoughts on the market, including information not available publicly, I urge you to sign up for my free e-mail list. Sign up today and you'll also get free, 7-day access to the Premium Sections on my website, including valuable tools and charts dedicated to serious PM Investors and Speculators. It's free and you may unsubscribe at any time.
Save time and money, by using our Premium Service! It saves you a great deal of time, as a large part of the analysis will be done for you. You pull the final strings, but you get a Premium version of our Updates, Alerts, Charts and Tools, which are bound to shorten the time that you need to make your investment- and speculation-related decisions. Saving time means saving money, and additionally - how much did you save by not selling at the beginning of September (recall that you received a free alert from me, in which I recommended holding your positions at that time)? I encourage you join other Subscribers that already enjoy and take advantage of the full version of the exclusive, premium commentary.
P. Radomski
--
Among other additional parts, the full version of this week's commentary includes a follow-up analysis of the Gold Miners Bullish Percent Index, which 2 weeks ago provided significant signals for the PM market. I also provide specific suggestions for Investors, Speculators, and Day-Traders interested in the precious metals.
