
This essay is based on the Premium Update posted on February 4th, 2011. Visit our archives for more gold articles.
Political and social unrest in the Middle East was the most discussed topic during the week. Restlessness and riots could inflate food prices in the region and worsen the economic balance further. As a result, equity, currency and commodity markets have experienced fluctuations. The political disturbances have impacted the crude oil trade significantly as Egypt is a crucial link for oil and gas headed to Europe, Asia and the United States. There are large black swans paddling in the Middle East pond that could have a significant effect on precious metals, oil and stock markets.
On the other side of the globe, the Chinese are celebrating their New Year, the Year of the Rabbit. This year China pulled a rabbit out of the hat and Chinas gold imports are estimated to have more than doubled from a year ago in the run-up to Chinese New Year. This means that China is on track to overtake India as the worlds largest consumer of the yellow metal. Traders say China will overtake India as the largest consumer of gold this year. The Indian festival of Diwali was once the key driver of seasonal demand patterns because of the large number of weddings taking place during the holidays. But Now Chinese New Year is starting to have a bigger impact.
The growth in demand is being attributed in part to Chinese families giving each other gifts of gold instead of traditional red envelopes filled with cash. Fears of inflation have also driven demand for gold. So if you have a (very good) friend in China you might consider buying them a gift of a small 100 ounce bar elaborately engraved with auspicious rabbit idioms or scenes of rabbits at play, or perhaps a 20-ounce carved rabbit bar.
As per the current fundamentals influencing gold price movement, the long-term suggestion would be a definite buy. To get an insight of current market sentiment, it is a better practice to account technical analysis separately. To see if we can pull a rabbit out of a hat and tell you how gold will perform in the near future let's begin this week's technical part with the analysis of the Euro Index. We will start with the short-term chart (charts courtesy by http://stockcharts.com)
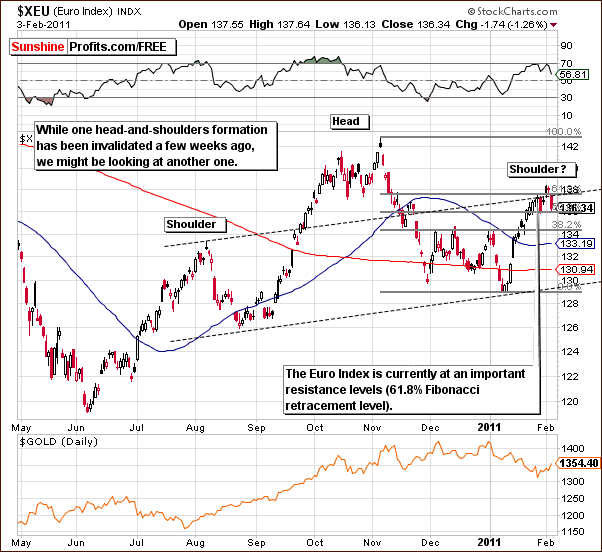
In the short-term Euro Index chart this week, we see a number of bearish signals, which will likely lead to a bullish sentiment for the USD Index as will be seen on the following chart. Here, we have originally seen that perhaps the right shoulder of the bearish head-and-shoulders formation has been invalidated at the beginning of this week. However, the price moved quickly below the rising dashed line, thus invalidating the insignificant breakout. Consequently, the head-and-shoulders formation is still forming.
This is of course a bearish signal going forward for the euro and of course will lead to a bullish sentiment for the USD Index as well as possibly for gold, silver and mining stocks. Of course the general stock market may also influence the precious metals sector to a great extent.
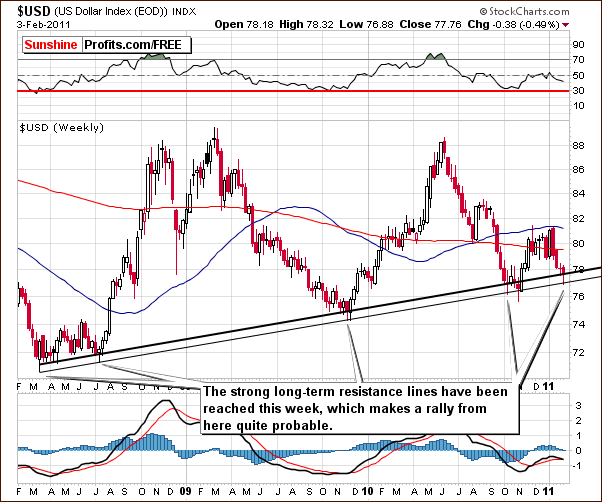
Our USD Index chart shows the close proximity at present to the long-term support level. This level has actually been touched and the index has once again begun to move higher. Based on this factor alone, a bounce would be likely, and we have another strong factor in favor of higher USD values - the cyclical turning points. The local bottom at the cyclical turning point is not likely to have any negative impact on gold, silver and mining stocks; there could, in fact, be a positive impact.
Although it is often believed that rising dollar is bearish news for gold, silver, and mining stocks, that was not the case during the past several months. The USD Index was leading precious metals, and now appears to be trending in tune with them.
Details, along with the cyclical turning points for the dollar, are visible on the chart below.
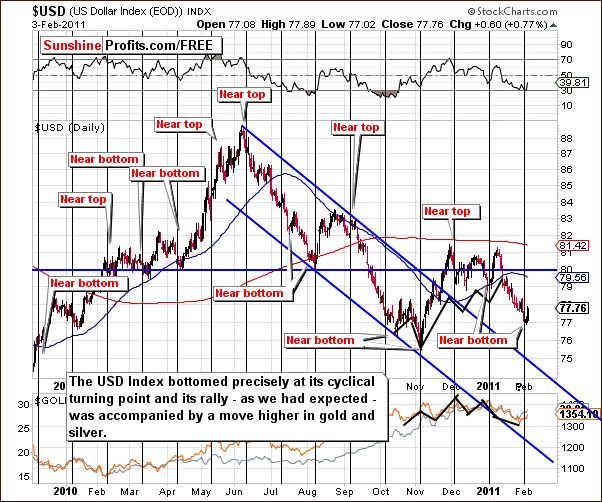
A closer look at the above chart shows that at least a local bottom has been reached precisely as indicated earlier at the cyclical turning point. Please note that the RSI indicator is also suggesting higher values of the index in the short run, as it reached the 30 level, which we view as a buy signal.
The technical situation in these two currency indices is particularly interesting, as the USD Index is likely to rally, which would cause the head-and-shoulders formation in euro to be completed. That would be likely cause a decline in Euro and further upswings in the USD Index.
Consequently, gold has been led by the price action of the dollar in recent weeks but now appear to be moving in tune with the trends seen in the USD Index. Of course, all this bullish sentiment is paired with just the opposite, a strong bearish outlook for the euro.
However, the question remains, if the current rally can be anything more than just a quick move up. The chart below suggests that its not out of the question.
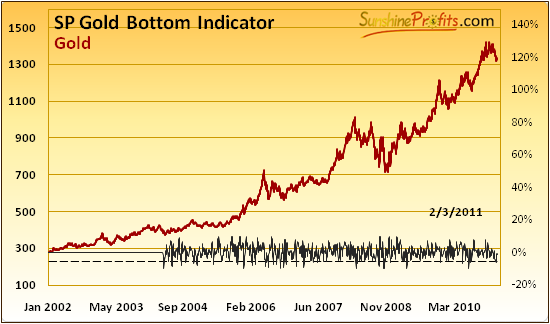
We featured the SP Gold Bottom Indicator on as another measure for the technical analysis over a week ago, when we wrote the following:
Finally, we have just seen a long-term buy signal from our SP Gold Bottom Indicator.
Previously we have seen it at the end of July 2010, right before the over-$200 rally, and before that we have seen it on May 21st, 2010 (another local bottom) Dec 9th, 2009 (insignificant bottom, however prices still moved briefly above it before the decline was over), and April 9th, 2009 (almost precisely at the bottom).
As you may see, we dont get this signal very often, but when we do, its worth taking it into account. The implications here are of course bullish.
The reason we mention this indicator today is that this signal means gain not only in the short run. Please take a look below for details (the blue line in the middle of the chart):
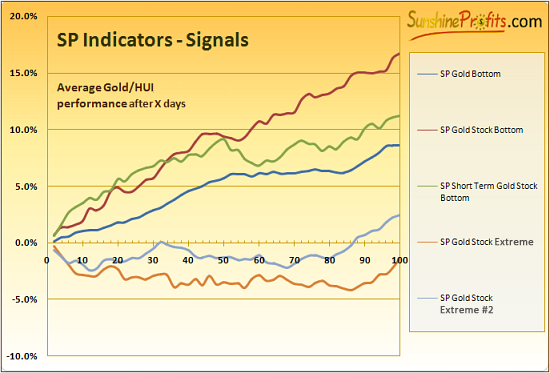
Taking other factors into account it is doubtful that the rally will be a straight line up, but the point is that this signal surely supports a rally from the current levels.
Summing up, the sentiment for gold here is clearly bullish for the short-term and while the medium-term situation remains mixed, please note that also based on the last two charts featured in this essay - at this point being out of the market with ones long-term capital is not advised.
To make sure that you are notified once the new features are implemented, and get immediate access to my free thoughts on the market, including information not available publicly, I urge you to sign up for my free e-mail list. Sign up today and you'll also get free, 7-day access to the Premium Sections on my website, including valuable tools and charts dedicated to serious PM Investors and Speculators. It's free and you may unsubscribe at any time.
Thank you for reading. Have a great weekend and profitable week!
P. Radomski
--
It seems like black swans are swimming in the Middle East pond with possible grave implications for oil, gold and stock markets. Is Egypt the second domino to fall in the Middle East? How stable is Saudi Arabia? We hope for peace but will buy gold just in case. That, after all, is one of the reasons to own gold in the first place. On the other side of the Globe the Chinese are celebrating their New Year and have managed to pull a rabbit out of the hat.
The USD Index moved higher recently and the situation bullish and the opposite is true for the Euro Index. Is that really bearish for gold? We don't think so, however, there are also other factors that one should take into consideration. The general stock market moved close to its previous high and stocks' leading indicators suggest caution. Meanwhile, silver's recent cyclical turning point marked the recent bottom in a perfect fashion. How far is silver likely to go? What's the target for gold, and mining stocks? All of this one much more (24 charts/tables!) is available in today's Premium Update.
Additionally, we clarify changes in rankings of top gold and silver juniors, and we comment on the performance of the SP Long-term Junior Indicator. We encourage you to Subscribe to the Premium Service today and read the full version of this week's analysis right away.
