
This essay is based on the Premium Update posted on April 16th, 2010. Visit our archives for more gold articles.
The current situation on the USD Index and gold appears to be in tune with each other even though the statistical numbers don't confirm it, which is a particularly interesting state. Therefore, we decided to provide you with a follow-up regarding our recent gold / usd analysis and let you know what we believe is going to take place in the gold market soon.
Let's begin this week's technical part with the analysis of the U.S. Dollar. Let's start with the long-term USD Index chart (charts courtesy by http://stockcharts.com.)
In our previous Premium Update we wrote the following:
The USD is about to test its previous high, which will further confirm a breakdown below the previous trading channel. .....the USD continues to move along this low end line. The RSI rebounded from last week's bottom further signifying that there will be a struggle to surpass the USD previous high.
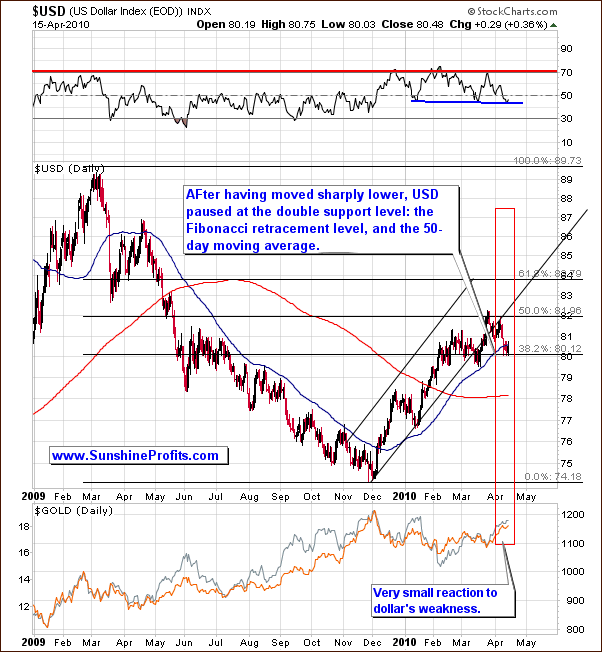
This week, the USD moved a bit lower, confirming the breakdown below the previous rising trend channel. This is an important development for precious metals investors, as the PM markets, of course, move in the opposite direction of the USD. Though this trend has not been true very recently, it is important to note that this week's move further verifies the breakdown below the uptrend. We can then conclude that lower values of the USD are to be expected in the medium term.
Clearly visible in the long term chart is an important note about the USD: currently there is a strong; in fact a double support level as the USD has paused at the Fibonacci retracement level and also at the 50-day moving average. This has historically been a very reliable support or resistance level (especially since April, 2009). If the USD is to break below this level soon (which we expect in the next week or two), it will serve as additional very strong confirmation of the direction in which the USD is going to move. Additionally, the current level (80) is a multi-year support level and consequently an important psychological level to move below. For PM's, this is bullish medium-term. However, this may not be the case in the short-term, since the USD moving to this support level created a possibility of a pullback. The RSI confirms this as it has dropped below 50 (around 45) and in 2010 this has marked a local bottom for the USD. Still, we expect that this time it may cause a small rally.
There has been only a very small reaction to the USD weakness. Gold and silver have recently been consolidating and this means that they may move lower before the bottom is in. This holds true for mining equities as well.
Therefore, the weakening USD will most likely continue to struggle, which is a good sign for PM investors in the medium term. However - based on the analysis of the U.S. Dollar - we expect some additional downward moves for gold, silver, and other metals before the bottom is in. As we stated last week and can comfortably repeat: The outlook for PMs is still bullish in the medium term though you might expect a slight decline before the true upward trend continues. Timing details are available to our Subscribers.
Moving on to the analysis of the gold market itself, let's take a look on the long-term chart.
In our previous commentary, we stated that gold has and will most likely continue to trend upwards in the coming weeks. Though a small correction may be likely very soon, it is probable that the upward trend will be delayed only for a very short period of time. Also, the self-similar pattern, which we were referring to in many previous reports, may be losing its accuracy.
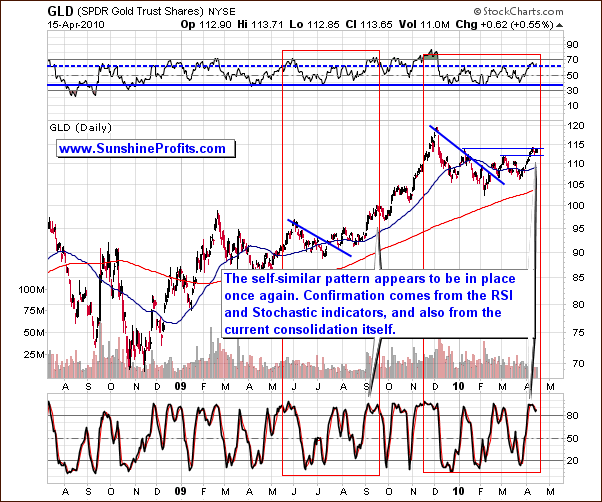
The good news this week is that the self-similar pattern seems to have returned. At least that what the long-term chart is suggesting, although confirmation of this is not crystal clear. There are some differences but it is much more useful than last week.
Gold's price moved higher and we are now seeing some consolidation as the RSI is higher than its recent previous highs. The Stochastic indicator also points us to a situation similar to September 2009. However, the rally is not as rapid and has not been confirmed by high volume. We expected to see higher volumes but they did not occur. History tends to rhyme, not necessarily to repeat itself word by word, and it seems that this is exactly what we've seen recently.
We are now trading between resistance and support levels. Previously we saw trading between February and June highs. The current correction should last for the next few days, which should make it slightly more visible on the long term chart.
The final confirmation comes from our unique indicators, which have recently flashed buy signals.
The indicator that was the first one to flash a buy signal (the indicator moved below the lower dashed line) was the SP Gold Bottom Indicator.
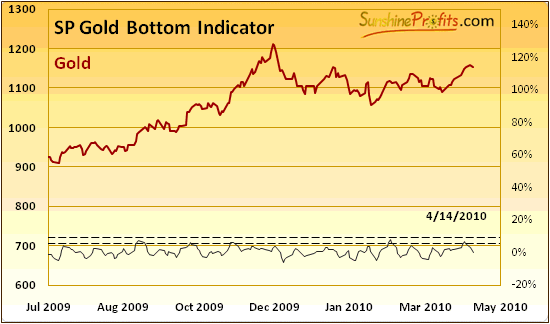
According to its name, we've designed this particular indicator to signal favorable buying opportunities in gold and this is exactly what it did this week. Please note that buying opportunity does not necessarily correspond to the exact bottom - it is rather a time/price combination, which will provide you with decent returns in several weeks, not necessarily right away.
Therefore, what this indicator signaled this week was that we are to see gold moving higher in the medium term - which confirmed what we had written in the previous essay - namely, that we are still bullish on gold in the medium term.
As far as short-term implications are concerned, please take a closer look at the above chart. There were several times when we've seen the buy signal during the past several months, and each time some kind of consolidation followed. Naturally, this is not very informative, because we already know that we have a consolidation right now, so the question is if we have seen the end of the correction or is it still ahead of us.
Based on the previous signals from the abovementioned indicator and what price action followed each of them, it seems that we will need to see more visible downswing before the rally continues. So far we've seen only a few signals from this indicator in the past several years (Sep 2009, Oct 2009, Nov 2009, and Feb 2010) and 3 out of 4 times (except Nov 2009) a visible correction materialized before rally's next stage. Therefore, this is what we expect to see also today.
Summing up, the USD Index appears to have reached a support and is likely to rally insignificantly from here, however at this point gold appears to be mostly moving on its own instead of following signals coming from the U.S. Dollar market. Still, based on the current analysis of charts it seems that the gold market is likely to move lower from here before resuming the rally. Targets / timing details along with suggestions regarding action that it would be best to take at this moment are available to our Subscribers in the full (5x bigger) version of this essay.
To make sure that you are notified once the new features are implemented, and get immediate access to my free thoughts on the market, including information not available publicly, I urge you to sign up for my free e-mail list. Sign up today and you'll also get free, 7-day access to the Premium Sections on my website, including valuable tools and charts dedicated to serious PM Investors and Speculators. It's free and you may unsubscribe at any time.
Thank you for reading. Have a great weekend and profitable week!
P. Radomski
--
The precious metals continue to trade sideways, while USD Index appears to have put a temporary bottom and the main stock indices continue to soar. What are the implications for Gold and Silver Investors and Traders? When is this correction going to end? What are the odds that PMs will move lower and where they might bottom? These are just a few of the questions that we deal with in this week's Premium Update.
This nearly 5000-world long commentary does not only include the in-depth analysis of the current situation on the metals market with detailed targets and suggestions on what action it would be best to take right now, but it also contains comments on how big influence the gov't gold sales are likely to have on the PM market.
The analysis includes: 3 charts dedicated to the USD Index, 3 charts dedicated to the main stock indices, 2 gold-, 2 silver-, and 2 mining stock charts along with the analysis of the Gold Miners Bullish Percent Index. Additionally, we've covered our correlation matrix, and two very recent signals from our unique indicators. We encourage you to Subscribe to the Premium Service today and read the full version of this week's analysis right away.
