
Based on the December 28th, 2012 Premium Update. Visit our archives for more gold & silver articles.
This week has brought in some calm after recent declines in the precious metals sector. Everybody seems to be waiting for some more decisive moves (both in the markets and on the part of the government, as the “fiscal cliff” issue has not been resolved yet), but these are not very likely before the beginning of the New Year.
Meanwhile, currency markets have been moving in the direction that makes precious metals investors happy – or should make them happy, were the situation “normal” – i.e. were the correlations between precious metals and the U.S. dollar strong and negative. Quite unfortunately, the situation is far from normal, but this is likely due to the abovementioned “fiscal cliff” problem and the uncertainty caused by the lack of final solution. Let us then move on to the technical part of today's essay and see what we can figure out from the charts and correlations – we'll start with the euro's long-term chart (charts courtesy by http://stockcharts.com.)
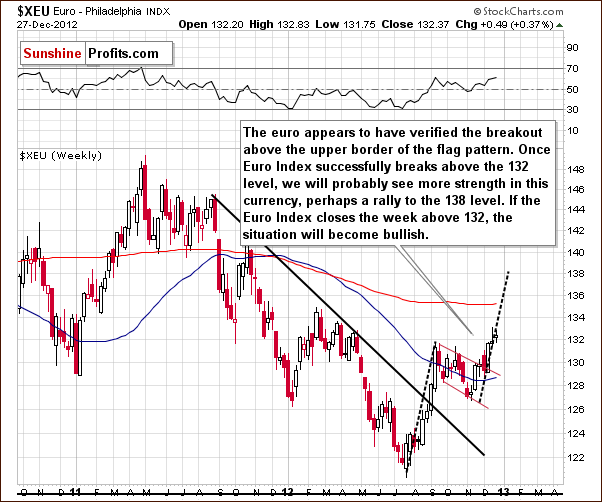
Recall that two weeks ago, we had discussed that if the index closed above 132, the breakout would be confirmed and higher values likely. A small decline was seen last Friday, but the Euro Index is once again above the 132 level. If it closes the week in this trading range, the breakout above the September high will be confirmed and a further move to the upside likely. The 138 level appears to be within reach if this holds true. All-in-all, the Euro Index picture this week has bearish implications for the dollar.
Now, let's move on to the U.S. currency – we'll start with the medium-term chart.
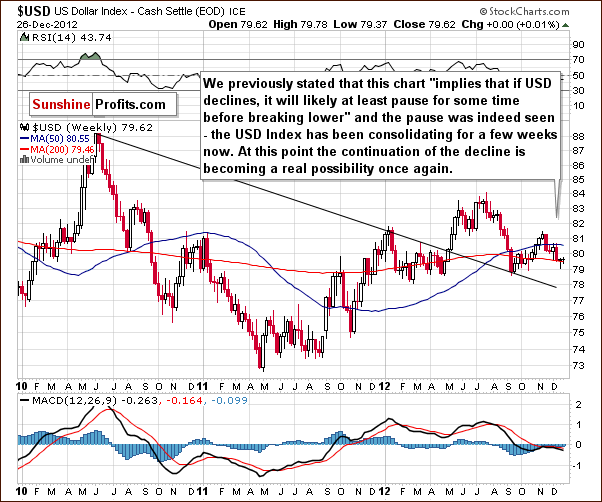
A consolidation has been ongoing for over a month, and the index now appears ready to move lower. The decline and consolidation here are a reflection of the upswing and consolidation seen recently in the Euro Index.
Let's have a look at the short-term USD Index chart now.
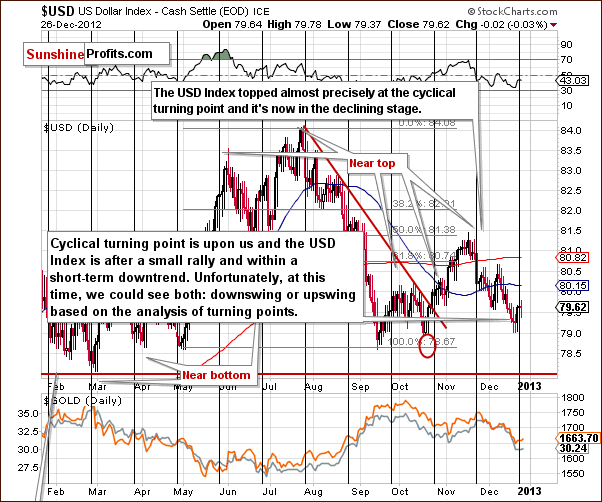
In the chart, there is an interesting development. A small rally lasting a few days has been seen and this makes the current situation quite confusing. The cyclical turning point is upon us and if it wasn't preceded by a pullback, higher values would be likely to follow. The very short-term trend however has already been to the upside, so we could see a reversal and lower index values. (The Euro Index could continue to rally without a pause as well, or more precisely, after a small pause that is not visible on the above chart that is created based on weekly candlesticks.) In short, it seems that lower values are more than likely to be seen in the USD Index. If the precious metals begin to respond positively to this weakness in the dollar, the short-term picture could quickly become bullish for gold, silver and mining stocks.
To put the above analysis into proper perspective, let's check the current correlation values.
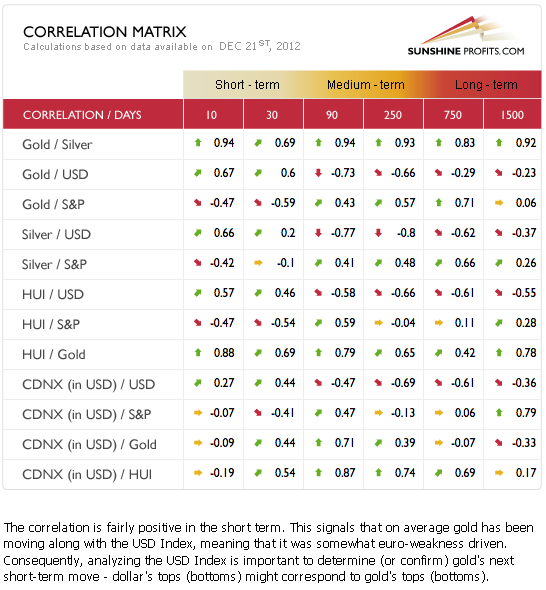
The Correlation Matrix is a tool which we have developed to analyze the impact of the currency markets and the general stock market upon the precious metals sector.
The Correlation Matrix is quite confusing this week as it shows that the coefficients have truly turned upside down. They are pretty much neutral for silver when it comes to the 30-day period, but clearly upside down for the 10-day one, as well as for gold and the precious metals mining stocks.
The strangest picture here is between gold and the USD. Gold generally moves opposite of the USD Index but has been pretty much in tune with it for the last 30 days and has moved in the opposite direction of stocks. In short, the situation is far from normal. However, it seems that this situation will turn back to normal quite soon and the chart below explains why.
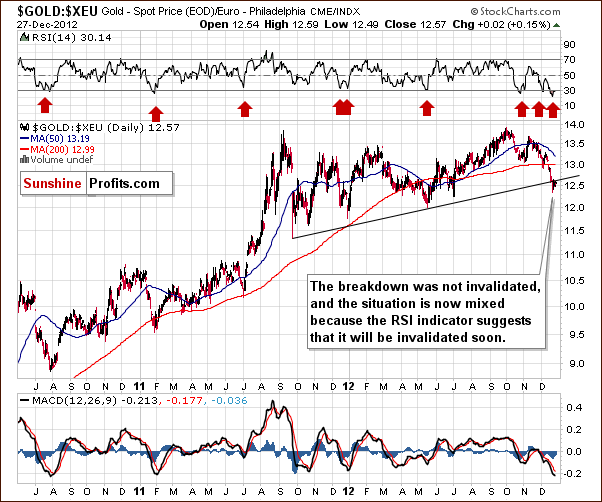
The decline in the above chart does quite a good job in representing the simultaneous slide in the dollar and the price of gold (the thing that made the correlations turn upside down in the past 30 trading days). On the above chart we see that the decline is excessive and likely to end or at least pause very soon, so the correlation might return to its normal state in a week or two.
The RSI levels are not much above 30, so further short-term strength is suggested here. If the breakdown is invalidated, the picture then would become clearly bullish.
Summing up, the situation in the Euro Index improved this week while it deteriorated in the USD Index. Since the cyclical turning point in the latter is quite close and a small rally was seen this week, the implications are bearish. If the precious metals sector begins to respond, then much more strength will likely be seen in gold, silver and mining stock prices.
We expect to see a return of the negative correlation between the USD Index and the precious metals very soon.
Thank you for reading. Have a great weekend, and a Happy New Year!
Sincerely,
Przemyslaw Radomski, CFA
