
Based on the July 22nd, 2011 Premium Update. Visit our archives for more gold articles.
Being technical analysts is one of our professions, so it is quite rarely when we feel any emotions regarding the market regardless if were making substantial gains or if were on the losing side. But, off the record, we will admit to a slight twinge of a thrill when gold broke the psychological barrier of $1,600 an ounce this Monday.
Putting aside the discussion on whether a breakout is likely to happen or not, its a great feeling having a front-row seat to the greatest investment show in town. And the best part is that its still Off Broadway and the crowds havent yet discovered it, so there is still time to get good seats.
How many of you remember the feeling when gold broke above $400 in December of 2003? Perhaps not all of you were in the gold trade at that time. So, lets jump forward to March 13th, 2008 when the benchmark gold contract traded over $1,000 for the first time in the U.S. futures market. The $1,000 markthat was a big one!
We remember other landmarks on golds upward journey. On December 1, 2009 - Gold climbs above $1,200 an ounce for the first time as the dollar dropped. On September 27 of that year, spot gold prices vaulted to the $1,300 an ounce mark. Just two months later, on November 8, gold prices broke through the $1,400 an ounce mark as haven buying prompted by renewed budget problems in Ireland more than offset a sharp dollar bounce. It wasnt so long ago that gold shot up above $1,500 an ounce on April 20th of this year as worries over the health of the global economy boosted the metal as a safe haven. And that brings us back to that lovely round number, $1600, achieved this week.
With the psychological barrier touched, it seems that this week the most important part of the analysis will come from the precious metals themselves. So, lets take a look at the yellow metal (charts courtesy by http://stockcharts.com).
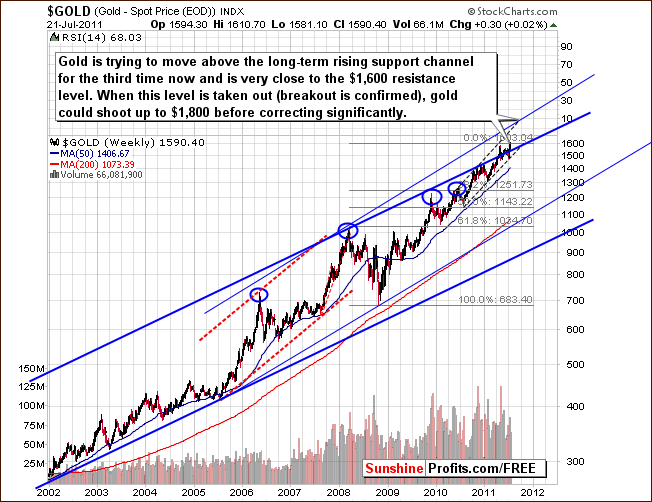
In this weeks very-long-term chart for gold, we barely see any changes. Gold has moved right to the resistance level created by extrapolating previous tops and bottoms. As we stated in our previous essay on the gold correction:
In very long-term chart for gold, we see a third attempt to move above the long-term rising trend channel. In late 2010, a similar attempt was unsuccessful and was followed by a significant decline. Certainly this could be the case this time as well. Naturally, we could see a true breakout, however so far it has not been confirmed yet, so we remain skeptical.
The current momentum, which gold has shown at the first sight seems to make the breakout theory quite probable (rallying on strong volume is bullish phenomenon), however, even gold is to rally strongly from here, a correction will likely be seen before additional significant upward movement starts. Please note that there is a strong resistance level created by extrapolating previous tops and bottoms and using the Phi #1.618. This is just above $1,600.
If gold can move above this level and confirm its move, the next target would be well above current prices. This would be quite a rally from here, but such a move does not seem very likely over the next few months at least not yet.
This week we did see prices reverse slightly and they are now consolidating. No breakout has yet been seen and our previous comments remain up-to-date. The situation continues to be quite similar to what we saw late last year (triple top) and it is clear that the consolidation at that time was quickly followed by a decline.
There was not breakout in gold stocks either.
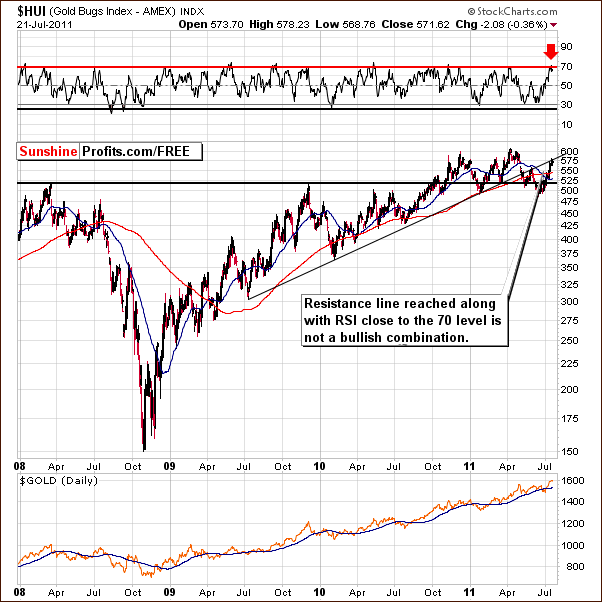
In this weeks HUI Index chart, little has changed and the chart is basically the same as what we presented to you last week. We continue to see a sell signal from the RSI level and the index level is at a noteworthy resistance line. No significant decline has been seen yet but it does appear to be quite likely in the near future.
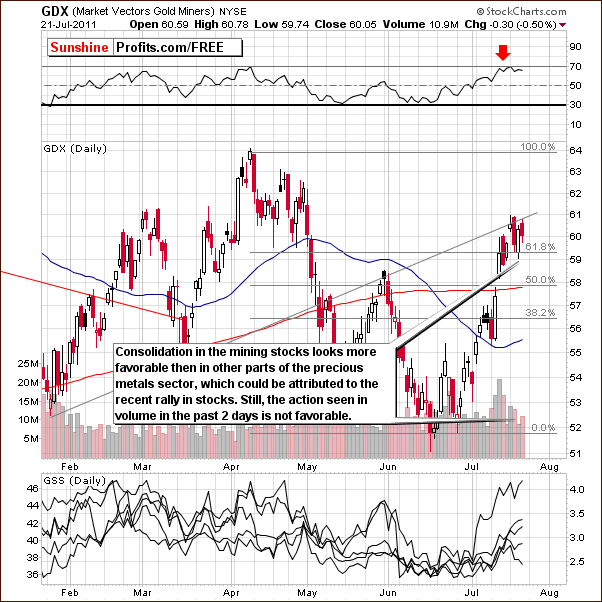
In this weeks short-term GDX ETF (another proxy for the mining stocks) chart, we see more of the same, although the situation is a bit more bullish here. A recent consolidation resulted in a bit higher mining stocks prices than it was the case with the underlying metals.
Thursdays decline was less significant here than were the declines for gold. The volume action seen was not too bullish however. The price decline on Thursday was accompanied by higher volume than was seen in Wednesdays rally. It is possible that the sign of strength seen here is at least partly attributable to the recent rally in the general stock market.
Summing up, the situation for the precious metals market appears very bullish at the first sight, but taking a second look reveals that the true breakout remains to be seen.
To make sure that you are notified once the new features are implemented, and get immediate access to my free thoughts on the market, including information not available publicly, we urge you to sign up for our free e-mail list. Sign up for our gold & silver mailing list today and you'll also get free, 7-day access to the Premium Sections on my website, including valuable tools and charts dedicated to serious PM Investors and Speculators. It's free and you may unsubscribe at any time.
Thank you for reading. Have a great weekend and profitable week!
P. Radomski
--
Gold stopped slightly above the important $1,600 level, but failed to hold this level. Is the following consolidation a top or a flag (continuation) pattern? Silver is likely to provide us with a significant timing signal today and today's Premium Update includes explanation of its implications on your silver investments.
Meanwhile, the situation in the main stock indices appears to be changing based on past days' events and today we take a closer look at the catalyst of this change.
Moreover, in today's Premium Update we reveal when we believe the final bottom will be seen for the whole precious metals sector. We encourage you to Subscribe to the Premium Service today and read the full version of this week's analysis right away.
