
The price of light crude surged last week as investors worried the crisis in Syria could spill over into other nations in the Middle East and disrupt oil supplies, especially if the United States conducted a major military strike. These concerns resulted in a new local top at $112,24 per barrel. Despite this improvement, in the following days, light crude declined as it appeared that a military strike against Syria would remain limited, quelling fears of supply disruptions in the Middle East.
Have there been any other circumstances which had an impact on the price of light crude in the recent weeks?
According to Reuters, the American Petroleum Institute reported that U.S. crude oil stocks fell last week by more than analysts had expected in a Reuters poll. The API said crude inventories fell by 4.2 million barrels in the week to Aug. 30 to 362 million, compared with analysts' expectations for a decrease of 1.3 million barrels. Despite this decline, oil prices didn’t change much after this announcement.
Taking into account the abovementioned circumstances, some investors might ask one question: did the recent drop change the outlook for crude oil? Let’s take a look at the charts and answer this question. Let’s start with a look at the daily chart of light crude (charts courtesy by http://stockcharts.com).
Quoting our last Oil Update:
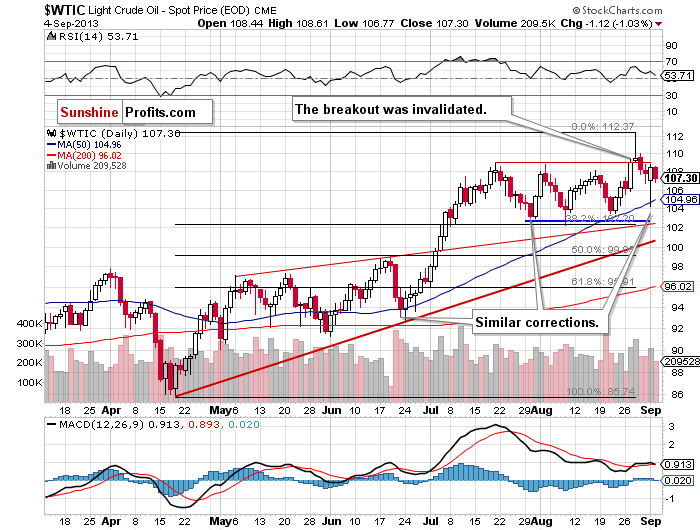
In this daily chart, we see that the situation hasn’t changed much in the recent days. Although light crude climbed and reached its highest level since May 2011, this improvement didn’t last long and the price slipped below the March 2012 and the July highs once again. In this way, the breakout above these peaks was invalidated.
Despite this downward move, the correction is still shallow at the moment because it hasn’t even reached the 38.2% Fibonacci retracement level. Additionally, the recent decline is similar to the previous ones, which is a bullish factor.
When we take a closer look, we see that the recent decline took the price of light crude below $105 and reached the 50-day moving average on Monday. Keep in mind that this support stopped the decline in June and, again, at the end of August (although it was not even reached) and encouraged buyers to act, which resulted in a sharp rally in the following days. As you see on the above chart, earlier this week we had a similar situation and light crude rebounded sharply to over $108 per barrel.
Taking the above into account, the short-term situation is bullish.
Where are the nearest support levels? The first one is the 50-day moving average (currently close to $105). The second one is the support zone (between $102.22 and $103.50) based on the bottom of the previous corrective move (the August 21 low) and the August low. There is also the 38.2% Fibonacci retracement level, which reinforces this support zone. The third one is the upper line of the rising wedge (currently slightly above $102).
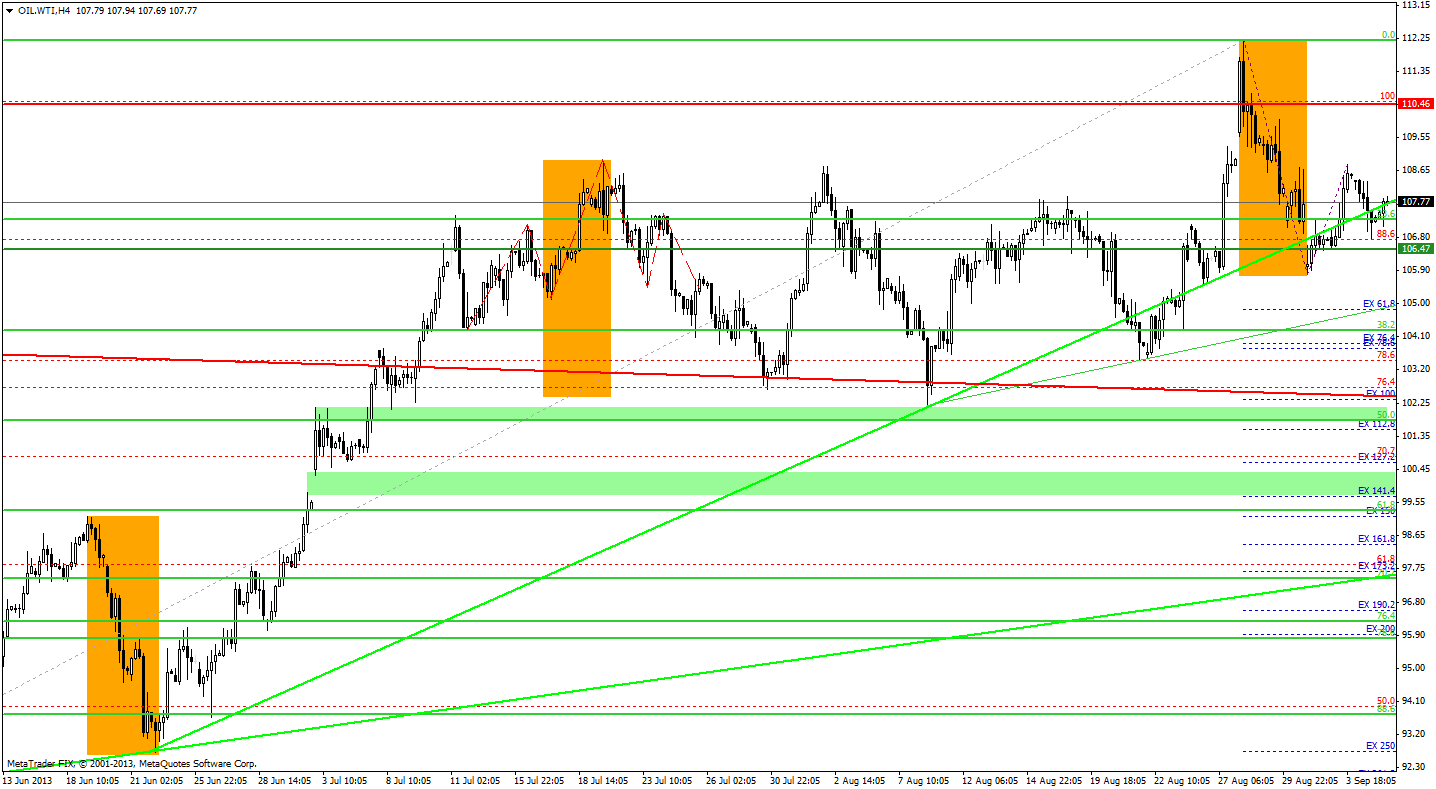
Once we know the current situation in the daily chart, let’s zoom in on our picture of the oil market and see the 4-hour chart.
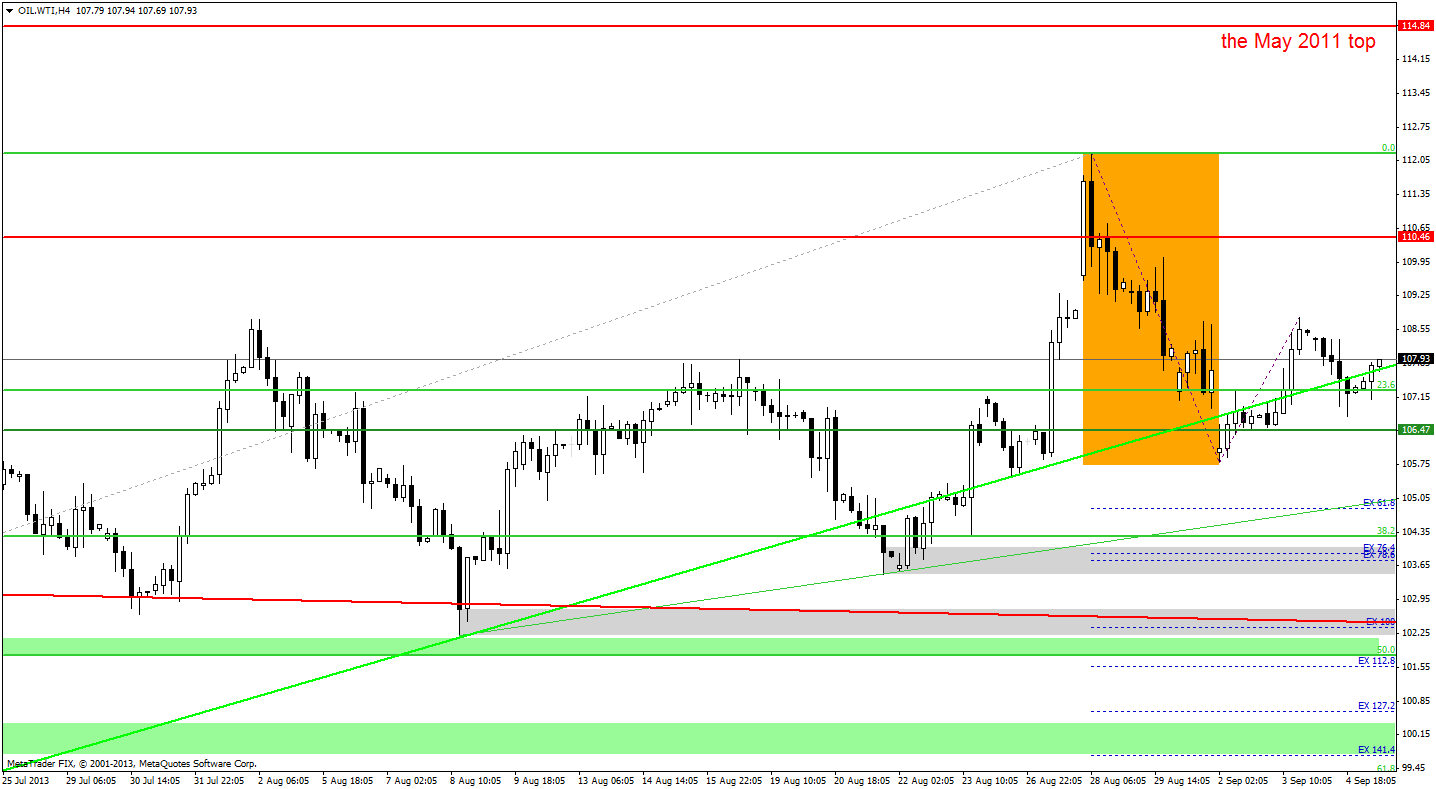
Let’s take the same chart and zoom in once again to see more details.
On the above chart, we see that recent decline took the price of light crude slightly below the rising support line based on the June 24 and August 8 lows. We saw similar price action in the previous month. Back then, the breakdown was invalidated, which resulted in a new local top being formed in the following days.
On Monday, oil bulls managed to push the price higher and the breakdown was invalidated, but we haven’t seen a sharp rally so far. However, light crude is still trading above this rising support line and if the buyers do not give up, crude oil will likely climb to at least the Tuesday high. If this resistance is broken, the next price targets for oil bulls will be around $110 and $112 per barrel.
On the other hand, we should be prepared for a bearish scenario. If the buyers fail and the price of light crude drops below Monday’s low, the next price target for the sellers will be around the August 21 bottom.
Summing up, although the breakout above the July top and the March 2012 top was invalidated, technically, the short-term outlook for light crude is still bullish. The uptrend is not threatened at the moment, because the recent decline is still shallow and similar to the previous ones.
Please note that the U.S. Energy Information Administration will report its closely watched oil inventory data today. The EIA data will appear one day later than usual due to the U.S. Labor Day holiday.
Thank you,
Nadia Simmons
