

Oil Trading Alert originally sent to subscribers on April 13, 2015, 8:54 AM.
Trading position (short-term; our opinion): No positions are justified from the risk/reward perspective.
On Friday, crude oil gained 2.05% as Baker Hughes report supported the price. In this way, light crude reversed and climbed to the previously-broken support/resistance line. Will we see a breakout in the coming days?
On Friday, Baker Hughes showed in its weekly report that the number of oil rig count dropped by 40 to 760 rigs (after slipping by just 11 last week and 12 in the prior week), which is the lowest weekly total since December, 2010. Please note that the oil rig count has fallen for 18 consecutive weeks and is down 53% from the recent peak of 1,609 rigs hit in October. In these circumstances, crude oil bounced off the session low, hitting an intraday high of $51.93 and increasing to the previously-broken resistance line. Will we see a breakout in the coming days? (charts courtesy of http://stockcharts.com).
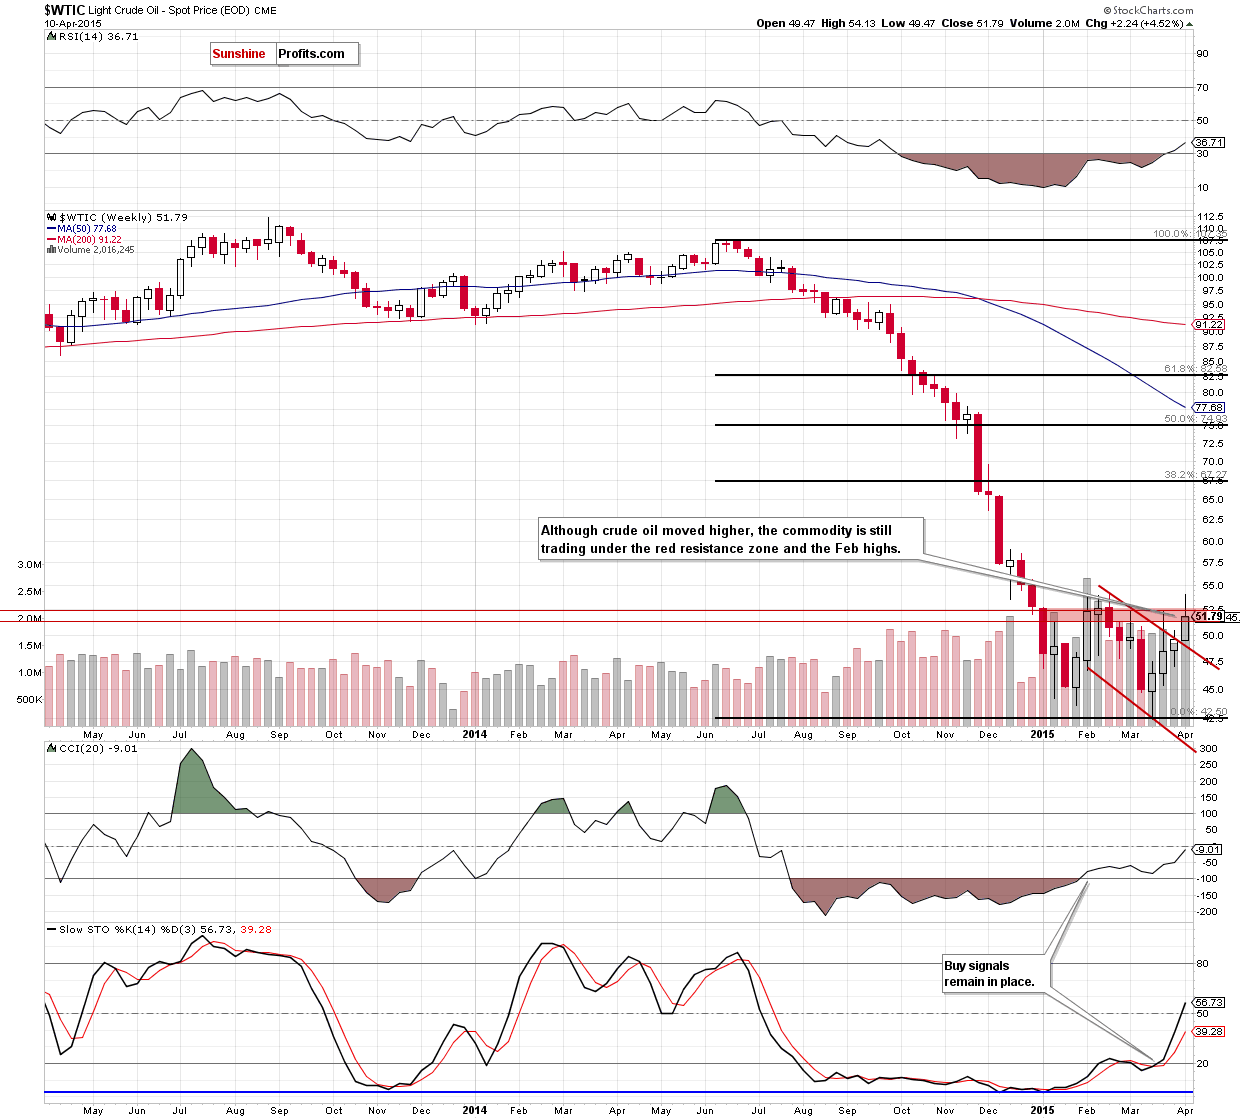
Although crude oil moved higher at the end of the week, the situation in the medium term hasn’t changed much as the commodity still remains under the Feb highs and the 76.4% Fibonacci retracement level. This means that as long as there is no breakout above this key resistance zone further improvement is not likely and another pullback can’t be ruled out. Please note that if light crude moves lower, the initial downside target would be the last weeks’ low (at $49.47) or even the previously-broken upper line of the declining trend channel (around $49) in the coming week.
Did this increase change the very short-term picture? Let’s examine the daily chart and find out.
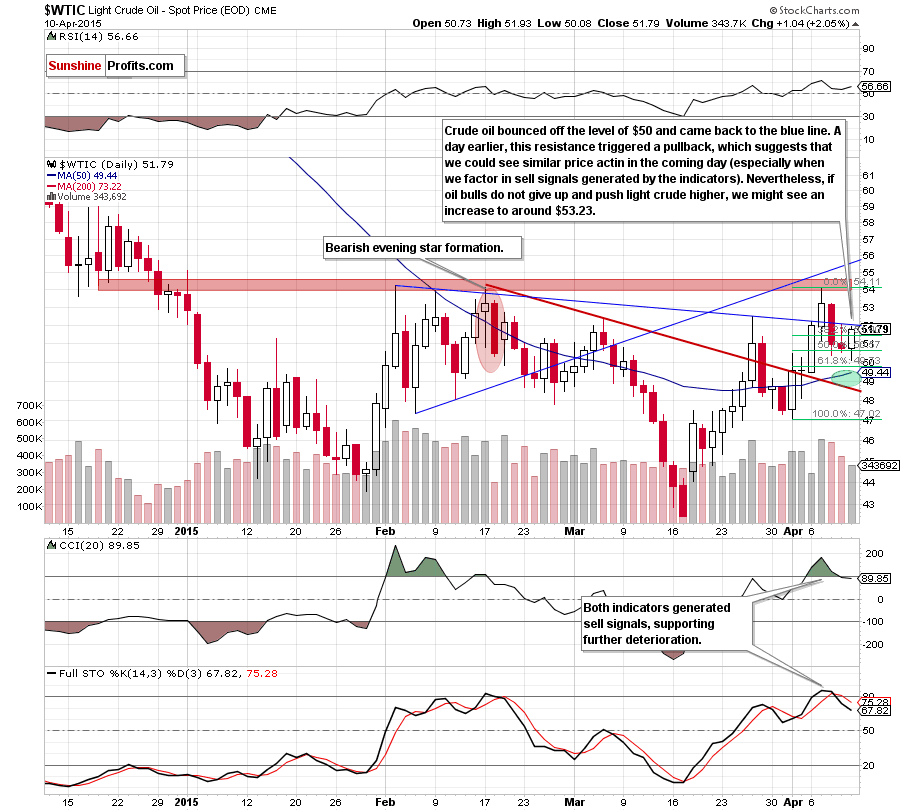
Looking at the daily chart, we see that crude oil bounced off the level of $50 and came back to the blue line. A day earlier this resistance triggered a pullback, which suggests that we could see similar price action in the coming day(s) – especially when we factor in sell signals generated by the indicators and the medium-term picture. In this case, the initial downside target would be the 50-day moving average (currently at $49.44) or even the previously-broken red support/resistance line (around $48.70).
Nevertheless, taking into account the fact that the commodity invalidated the breakdown under the 50% Fibonacci retracement level (based on the Apr rally), it seems that oil bulls might try to push light crude higher once again. If this is the case, and crude oil invalidates the breakdown under the blue line, we might see an increase to around $53.23, where the Apr 8 high is.
Summing up, crude oil bounced off the session low and climbed o the previously-broken blue line. Taking into account an invalidation of the breakdown under the 50% Fibonacci retracement (based on Apr rally), it seems that we might see another attempt to break above this resistance later in the day. Nevertheless, as long as the commodity remains below it, further improvement is questionable and a pullback from here can’t be ruled out.
Very short-term outlook: mixed
Short-term outlook: mixed
MT outlook: mixed
LT outlook: bullish
Trading position (short-term; our opinion): No positions are justified from the risk/reward perspective at the moment, but we will keep you informed should anything change.
Thank you.
Nadia Simmons
Forex & Oil Trading Strategist
Przemyslaw Radomski, CFA
Founder, Editor-in-chief
Gold & Silver Trading Alerts
Forex Trading Alerts
Oil Investment Updates
Oil Trading Alerts
