

Oil Trading Alert originally sent to subscribers on February 23, 2015, 5:32 AM.
Trading position (short-term; our opinion): No positions are justified from the risk/reward perspective.
On Friday, crude oil lost 2.72% as slowing cuts to rig counts and historically high U.S. supplies weighed on the price. In these circumstances, light crude declined, invalidating earlier breakout above the resistance levels. Does it mean that we’ll see crude oil below $50 in the coming days?
On Thursday, the U.S. Energy Information Administration reported that domestic crude oil inventories rose by 7.7 million barrels in the week ended February 13 and reached another record last week (425.6 million barrels), which clearly suggests that lower prices haven’t begun to affect production yet. As a result, light crude slipped below $50 for the first time since week. Although the commodity rebounded later in the day, Friday’s Baker Hughes report disappointed market participants. As a reminder, rig counts moved lower once again, but the 37-rig decline was less than half of that registered a week ago. The data fueled worries that production won’t fall to balance the market as quickly as some had hoped, which pushed the price of the commodity to an intraday low of $50.71. Will we see light crude below $50 in the coming days? (charts courtesy of http://stockcharts.com).
On Friday, we wrote the following:
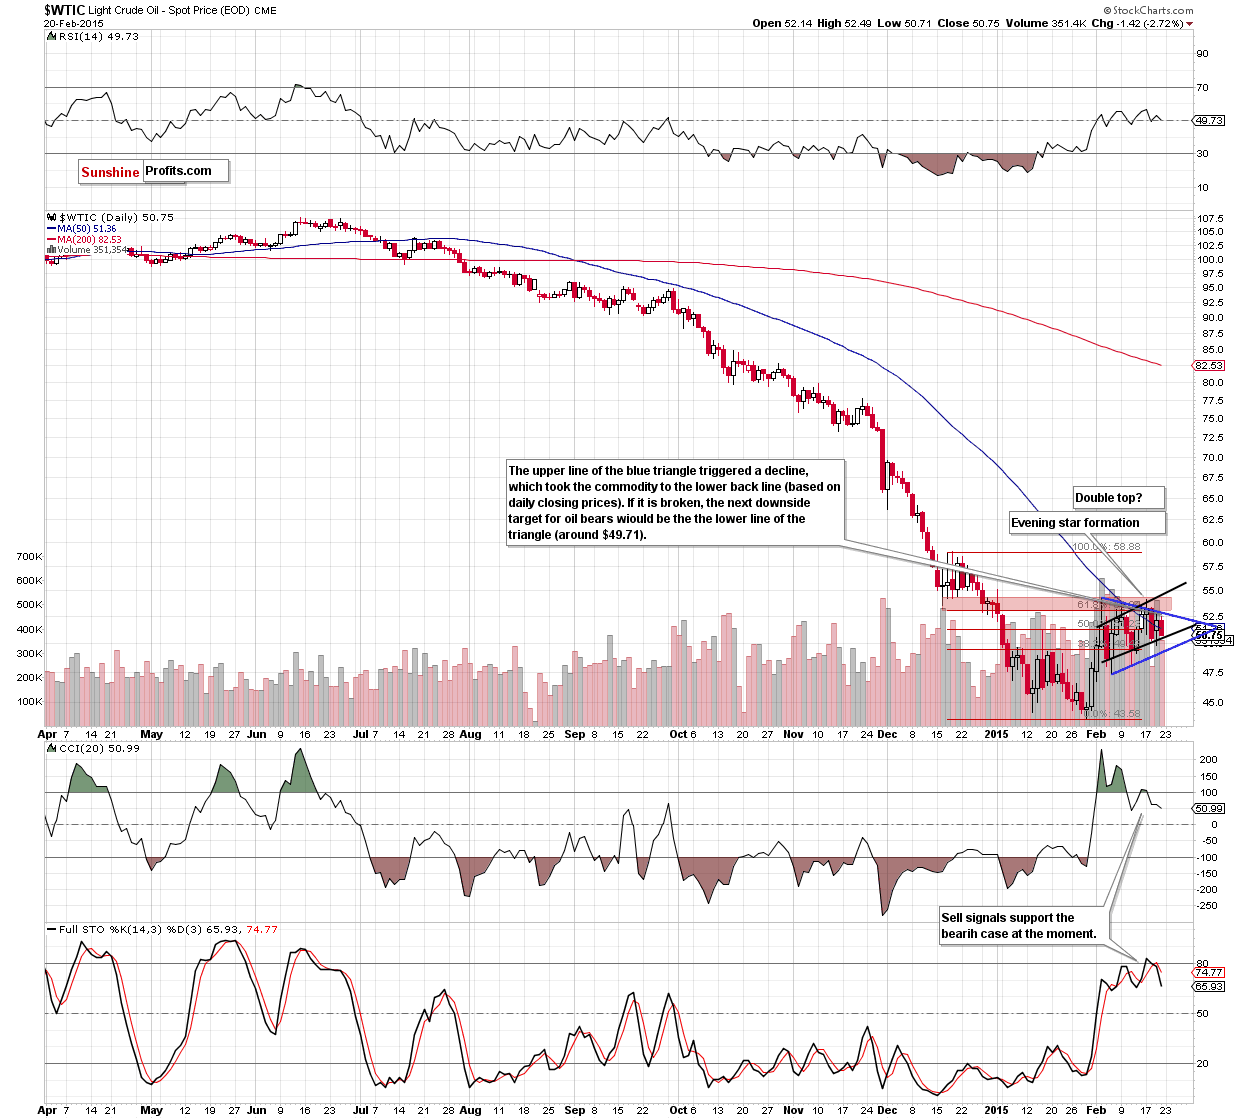
(…) light crude slipped below $50, but then rebounded sharply and approached the upper line of the triangle. Did this increase change anything? Not really. The reason? As you see on the above chart, despite this increase, the commodity is still trading in a triangle, under the previously-broken 61.8% Fibonacci retracement, the Dec lows and well below the black resistance line. Additionally, the bearish evening star formation and sell signals generated by the CCI and Stochastic Oscillator are still in play, supporting the bearish case. Taking these facts into account, we think that as long as the red resistance zone is in play further rally is questionable and another pullback from here (…) is likely.
As you see on the daily chart, oil bears pushed the commodity lower as we expected. The upper line of the blue triangle triggered a decline, which took the commodity to the lower black support line (based on the daily closing prices). Although we could see a small rebound from here (to the upper line blue line), it seems that all the above-mentioned negative signals will encourage oil bears to act and light crude will move lower once again. Therefore, we think that a breakdown under the nearest support line will accelerate further deterioration and trigger a drop to the next downside target - the lower line of the triangle (currently at $49.71).
Are there any medium-term factors that could support or hinder this scenario? Let’s examine the weekly chart and find out.
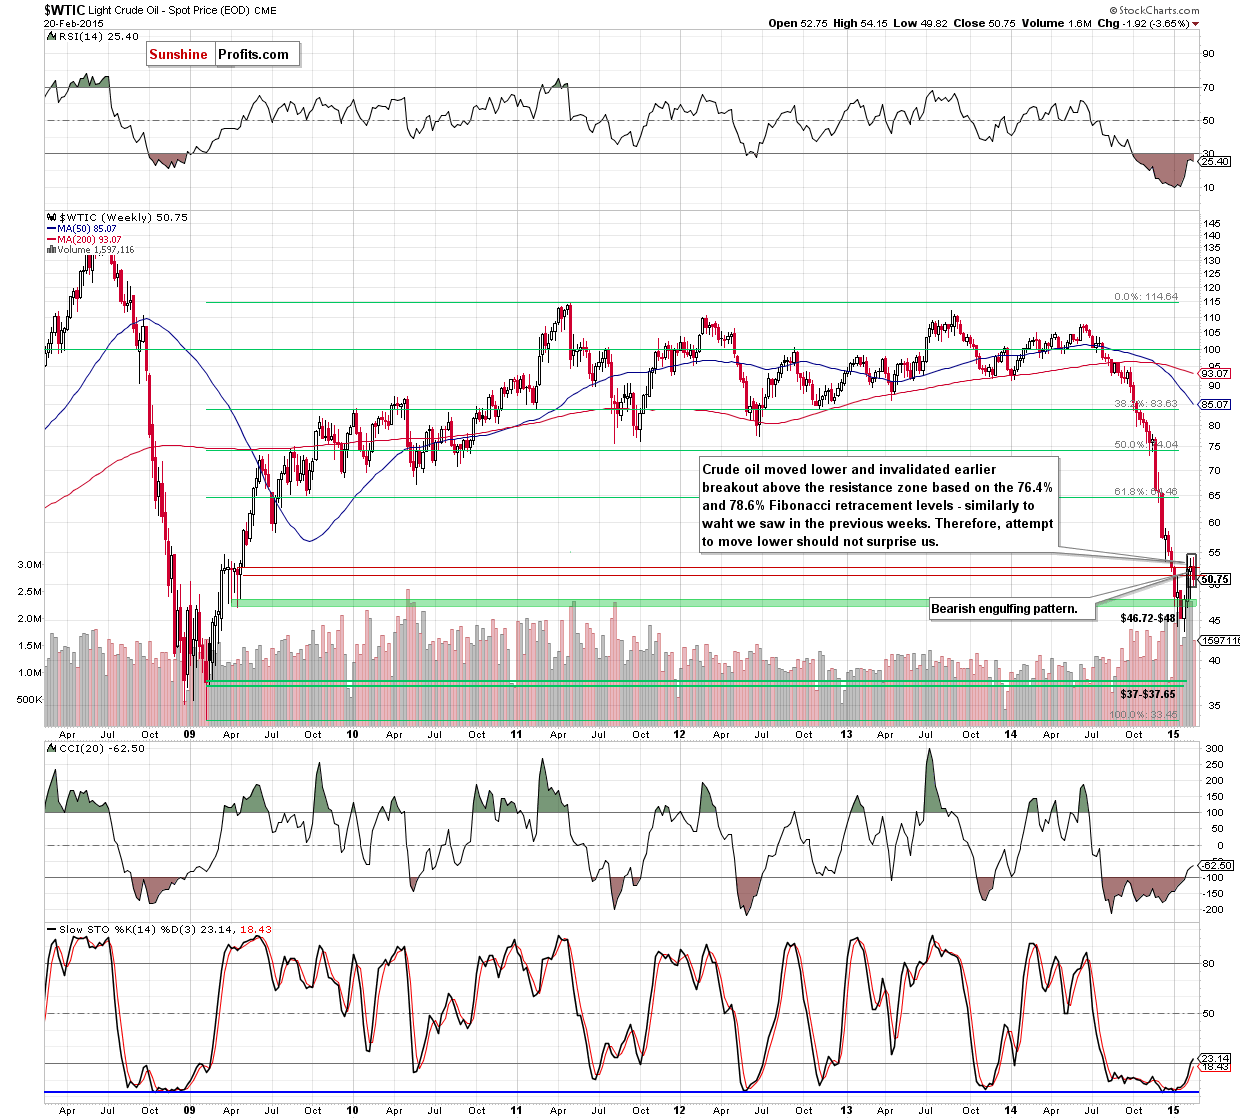
From this perspective, we see that Friday’s drop pushed the commodity under the resistance zone created by the 76.4% and 78.6% Fibonacci retracement levels. In this way, crude oil closed the week under these levels for the first time in Feb. (it was also the oil market’s first weekly loss in nearly a month). Additionally, when we take a closer look at the chart, we can see that the recent candlesticks formed a bearish engulfing pattern. Taking all the above into account, and combining it with the very short-term picture, we still believe that as long as the commodity is trading below $53.13-$54.24 further rally is doubtful and another test of the support zone based on the Apr 2009 lows is likely.
Summing up,crude oil moved lower and closed the week under the resistance zone created by the 76.4% and 78.6% Fibonacci retracement levels for the first time in Feb. (it was also the oil market’s first weekly loss in nearly a month). Taking this fact into account, and combining it with the very short-term picture and the bearish engulfing pattern (marked on the weekly chart) we think that another downswing is more likely than not (especially if the commodity breaks below the black support line marked on the daily chart). If this is the case, the next target would be around $49.71, where the lower line of the blue triangle is.
Very short-term outlook: mixed
Short-term outlook: mixed
MT outlook: mixed
LT outlook: bullish
Trading position (short-term; our opinion): No positions are justified from the risk/reward perspective. Nevertheless, if we see a daily close above the upper line of the blue triangle and the black resistance line, we’ll consider opening long positions. We will keep you informed should anything change.
Thank you.
Nadia Simmons
Forex & Oil Trading Strategist
Przemyslaw Radomski, CFA
Founder, Editor-in-chief
Gold & Silver Trading Alerts
Forex Trading Alerts
Oil Investment Updates
Oil Trading Alerts
