

Oil Trading Alert originally sent to subscribers on February 11, 2015, 8:51 AM.
Trading position (short-term; our opinion): No positions are justified from the risk/reward perspective.
On Tuesday, crude oil lost 2.80% as a combination of weak Chinese price data, and bearish reports from the International Energy Agency and the U.S. Energy Information Administration weighed on the price. In response to these circumstances, light crude declined, invalidating earlier breakouts and losing for the first time in four sessions. Does it mean that the recent rally is over?
Yesterday’s data showed that China's January CPI rose 0.8%, missing analysts’ expectations for a 1.0% gain (year-on-year), while PPI dropped 4.3%, compared to a fall of 3.8% year-on-year expected, which is the steepest drop since October 2009.
Later in the day, the IEA predicted in its Medium Term Oil Market report that global demand for OPEC crude will rise in 2016 to 29.90 million bpd, after holding at 29.4 million this year. The report also showed that the U.S. will remain the world's top source of oil supply growth until 2020. On top of that, the U.S. Energy Information Administration (EIA) added in a separate report that kept its 2015 and 2016 domestic oil production expectations unchanged from the previous month. The outlook, which emerged from these reports, was more bearish than OPEC's monthly report and resulted in a pullback that took the commodity below $50 (an intraday low of $49.86) for the first time since Feb 5. Will we see another drop under this level in the coming days? (charts courtesy of http://stockcharts.com).
In our previous Oil Trading Alert, we wrote the following:
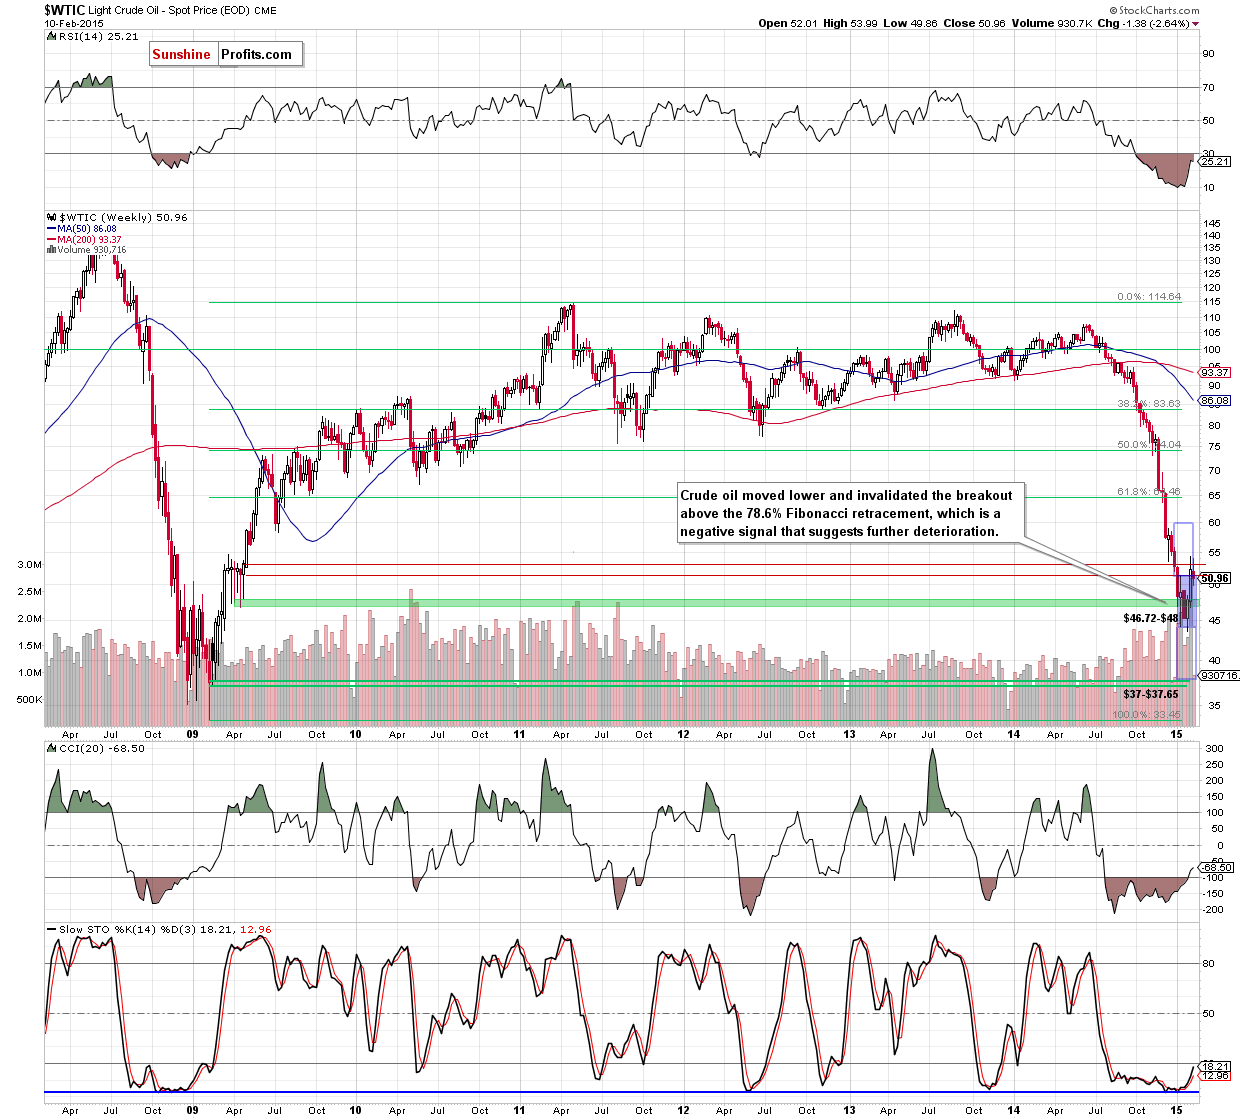
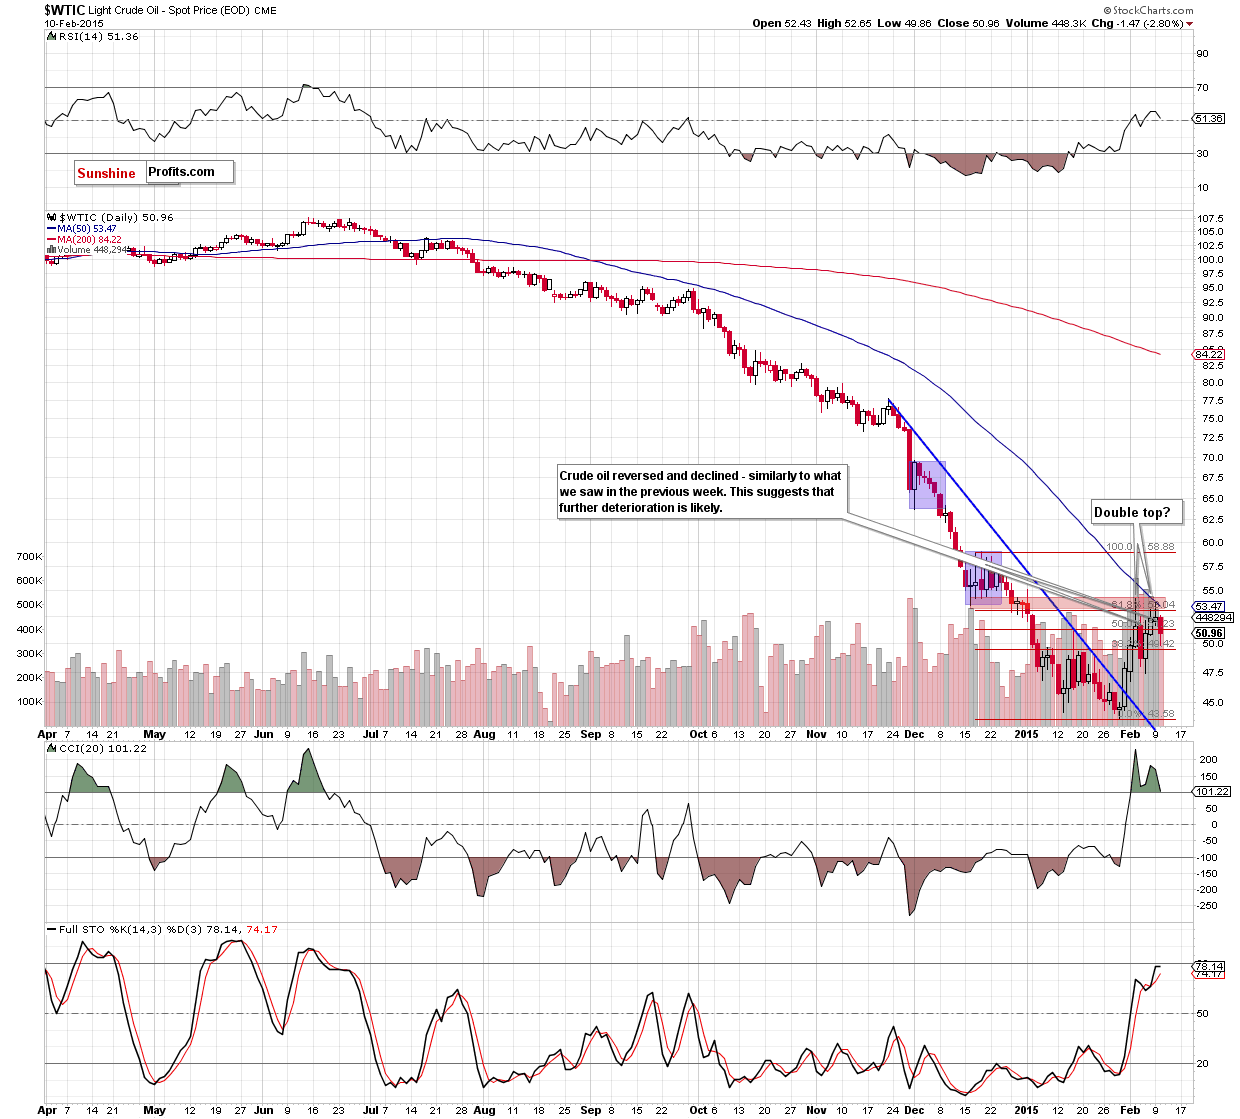
(…) crude oil moved higher once again and climbed above the 76.4% Fibonacci retracement level (marked on the weekly chart) and the 61.8% retracement (based on the Dec-Jan decline and seen on the daily chart), approaching the previously-broken 50-day moving average. (…) oil bulls didn’t manage to hold gained levels, which triggered a pullback and resulted in an invalidation of earlier breakout (a bearish sign). (…) the recent upward move materialized on decreasing volume, which suggests that oil bulls might not be as strong as it seems at the first sight. On top of that, (…) white candles were getting smaller, which in combination with yesterday’s longer upper shadow (the longest since Feb 3) and the above-mentioned invalidation of the breakout suggests a reversal and further declines. (...) we saw similar price action at the begining of the month. Back then, similar factors triggered a sharp decline, which took the commodty to an itraday low of $47.36. Taking this fact into account, and combining it with the solid resistance zone (...), the likelihood of bigger pullback increases (...). If this is the case, the initial downside target for oil bears would be around $50.17, where the 38.2% Fibonacci retracement (based on the entire Jan-Feb rally) is.
As you see on the charts, the sitaution developed in line with the above-mentioned scenario as crude oil reversed and reached our downside target. Although the commodity rebounded in the following hours, light crude closed the day below the previously-broken 50% Fibonacci retracement (based on the Dec-Jan decline and seen on the daily chart), invalidating earlier breakout.
With this downswing, the commodity also slipped under the 78.6% Fibonacci retracement level (marked on the weekly chart), which means that the breakout was invalidated. These are bearish signals, which together with the current position of the daily indicators (the CCI is very close to generating a sell signal, while the Stochastic Oscillator is overbought) suggest further deterioration. If this is the case, the initial target for oil bears would be the 50% Fibonacci retracement based on the entire Jan-Feb rally (around $48.91) or even the Feb 5 low of $47.36.
Before we summarize today’s alert please note that yesterday, after markets closed, the American Petroleum Institute, reported that U.S. crude inventories increased by 1.6 million barrels in the week ended February, while gasoline stockpiles rose by 1.6 million barrels and distillate stocks increased by 497,000 barrels. The report showed a smaller increase in domestic inventories (compared to a build of 6.1 million in the preceding week), but it is hard to take it as improvement. In our opinion, if today’s EIA report shows bigger increase than the above, the probability of the bearish scenario will increase significantly.
Summing up,the solid resistance zone created by the 76.4% retracement level (marked on the weekly chart), the 61.8% retracement (based on the Dec-Jan decline and seen on the daily chart), Dec lows and the 50-day moving average triggered a pullback as we expected. With this move, the commodity invalidated the breakout above the previously-broken 50% Fibonacci retracement (based on the Dec-Jan decline) and the 78.6% retracement level (seen on the weekly chart), which suggests further deterioration and a drop to around $48.91or even the Feb 5 low of $47.36 in the coming day(s).
Very short-term outlook: mixed
Short-term outlook: mixed
MT outlook: mixed
LT outlook: bullish
Trading position (short-term; our opinion): No positions are justified from the risk/reward perspective. Nevertheless, if we see a daily close above the 61.8% Fibonacci retracement based on the Dec-Jan decline, we’ll consider opening long positions. We will keep you informed should anything change.
Thank you.
Nadia Simmons
Forex & Oil Trading Strategist
Przemyslaw Radomski, CFA
Founder, Editor-in-chief
Gold & Silver Trading Alerts
Forex Trading Alerts
Oil Investment Updates
Oil Trading Alerts
