
Oil Trading Alert originally sent to subscribers on February 5, 2015, 7:54 AM.
Trading position (short-term; our opinion): No positions are justified from the risk/reward perspective.
On Wednesday, crude oil lost 5.57% as a bearish EIA weekly report and a stronger greenback weighed on the price. As a result, light crude reversed and declined sharply, approaching the Apr 2009 lows once again. Will we see another breakdown?
Yesterday, the U.S. Energy Information Administration reported that U.S. crude oil inventories rose by 6.3 million barrels in the week ended January 30, missing expectations for an increase of 3.5 million barrels. At this point, it’s worth noting that total domestic crude oil inventories stood now at 413.1 million barrels, which is the highest level since August 1982. Additionally, the report also showed that total gasoline inventories increased by 2.3 million barrels (more than expectations for a gain of 0.1 million), while distillate stockpiles rose by 1.8 million barrels. These bearish numbers, in combination with a stronger greenback pushed the price of the commodity to an intraday low of $47.95, approaching light crude to the Apr 2009 lows. Will we see lower prices in the coming day(s)? (charts courtesy of http://stockcharts.com).
In our previous Oil Trading Alert, we wrote the following:
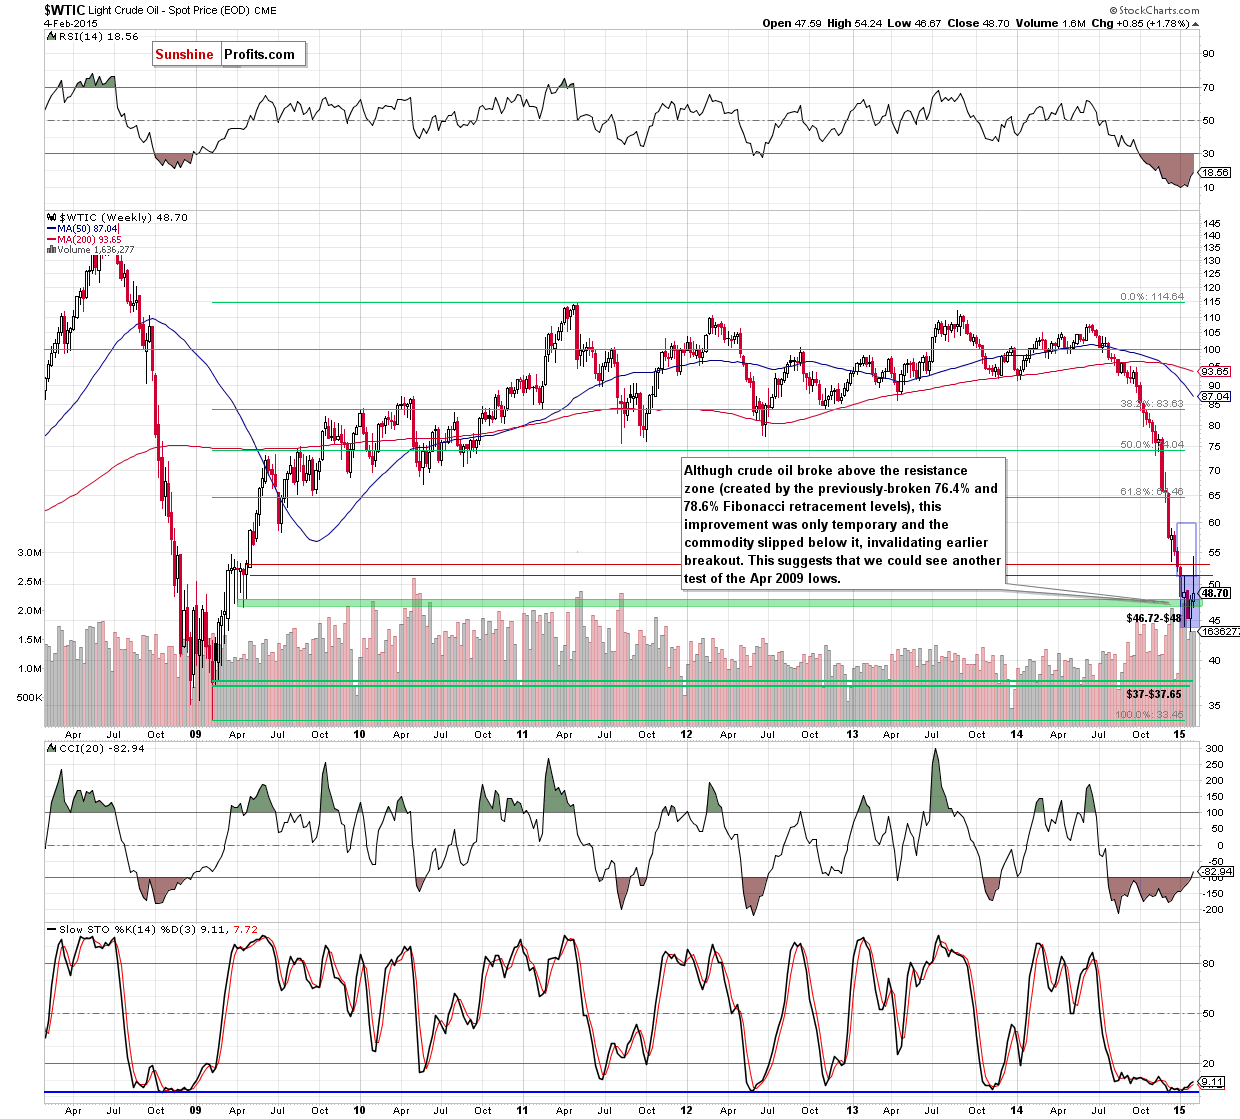
(…) we would like to draw your attention to the fact that, despite the rising volume, white candles were getting smaller, which in combination with yesterday’s long upper shadow and an invalidation of the breakout above the 76.4% and 78.6% Fibonacci retracement levels (marked on the weekly chart), suggests a reversal and further declines (especially after an invalidation of the breakout above the 50% retracement and the Jan 15 high, which will likely accelerate deterioration). If this is the case, the initial downside target for oil bears would be around $49.50, where the previously broken 38.2% Fibonacci retracement is.
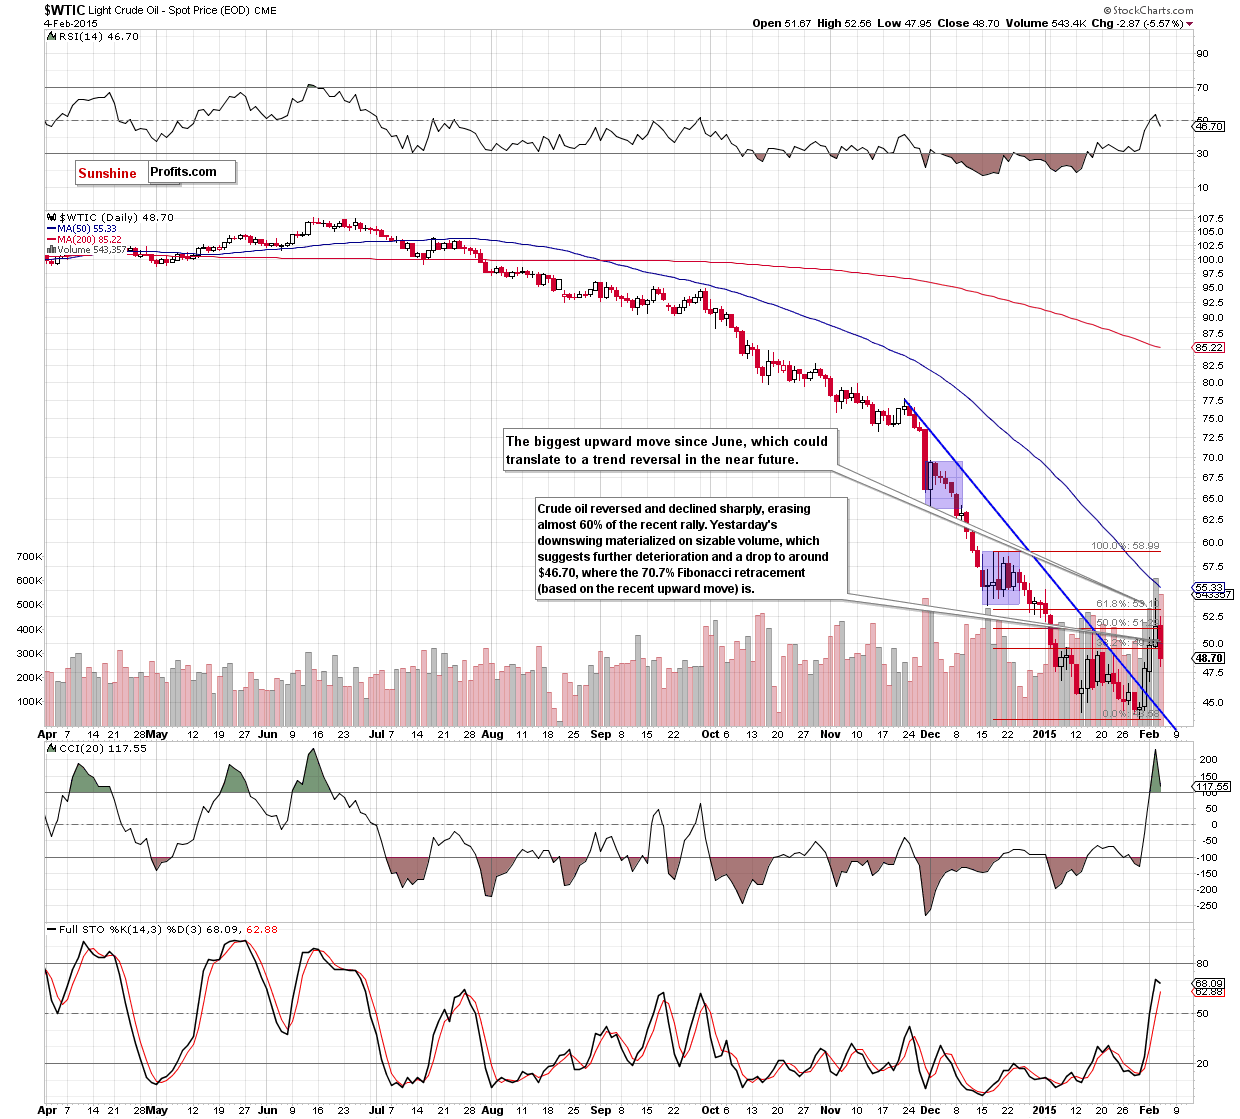
As you see on the daily chart, oil bears not only took the commodity to our downside target, but also managed to push the price below it. In this way, crude oil erased almost 60% of the recent rally and approached the support zone based on the Apr 2009 lows. When we take a closer look at the above chart, we see that yesterday’s downswing materialized on a sizable volume (not as huge as a day before, but still much bigger than downswings that we saw in the previous month), which suggests further deterioration and a drop to around $46.70, where the 70.7% Fibonacci retracement (based on the recent upward move) and the Apr 2009 lows are.
Summing up, crude oil reversed and declined sharply on sizable volume, which suggests further deterioration and a drop to around $46.70 (where the 70.7% Fibonacci retracement based on the recent upward move and the Apr 2009 lows are) in the coming day(s). Taking the above into account, we think that opening any positions is too risky at the moment.
Very short-term outlook: mixed
Short-term outlook: mixed
MT outlook: mixed
LT outlook: bullish
Trading position (short-term; our opinion): No positions are justified from the risk/reward perspective. Nevertheless, if we see another daily close above the Jan 15 high of $51.27, we’ll consider opening long positions. We will keep you informed should anything change.
Thank you.
Nadia Simmons
Forex & Oil Trading Strategist
Przemyslaw Radomski, CFA
Founder, Editor-in-chief
Gold & Silver Trading Alerts
Forex Trading Alerts
Oil Investment Updates
Oil Trading Alerts
