
Oil Trading Alert originally sent to subscribers on January 28, 2015, 6:43 AM.
Trading position (short-term; our opinion): No positions are justified from the risk/reward perspective.
On Tuesday, crude oil gained 1.55% after mixed U.S. data weakened the greenback. As a result, light crude climbed above $46, but the nearest resistance still keeps gains in check. Will we see higher values of the commodity in the coming days?
Yesterday, the U.S. Commerce Department showed that total durable goods orders dropped 3.4% last month, missing expectations for a gain of 0.5%, while core durable goods orders (without volatile transportation items) declined by 0.8% in the previous month, disappointing forecasts for a 0.6% gain. Thanks to these numbers, the U.S. dollar moved lower, making crude oil more attractive for buyers using foreign currencies. Additionally, later in the day, the U.S. Commerce Department showed that new home sales increased by 11.6% to a seasonally adjusted 481,000 units in December, beating expectations for a gain to 450,000. Additionally, the Conference Board reported that its index of consumer confidence improved to 102.9 in January and climbed to the highest level since August 2007. These solid numbers supported the commodity as well and pushed it to an intraday high of $46.55. Despite this increase, the resistance zone stopped further improvement. Did yesterday’s upswing was the first step towards higher levels or rather verification of the breakdown? (charts courtesy of http://stockcharts.com).
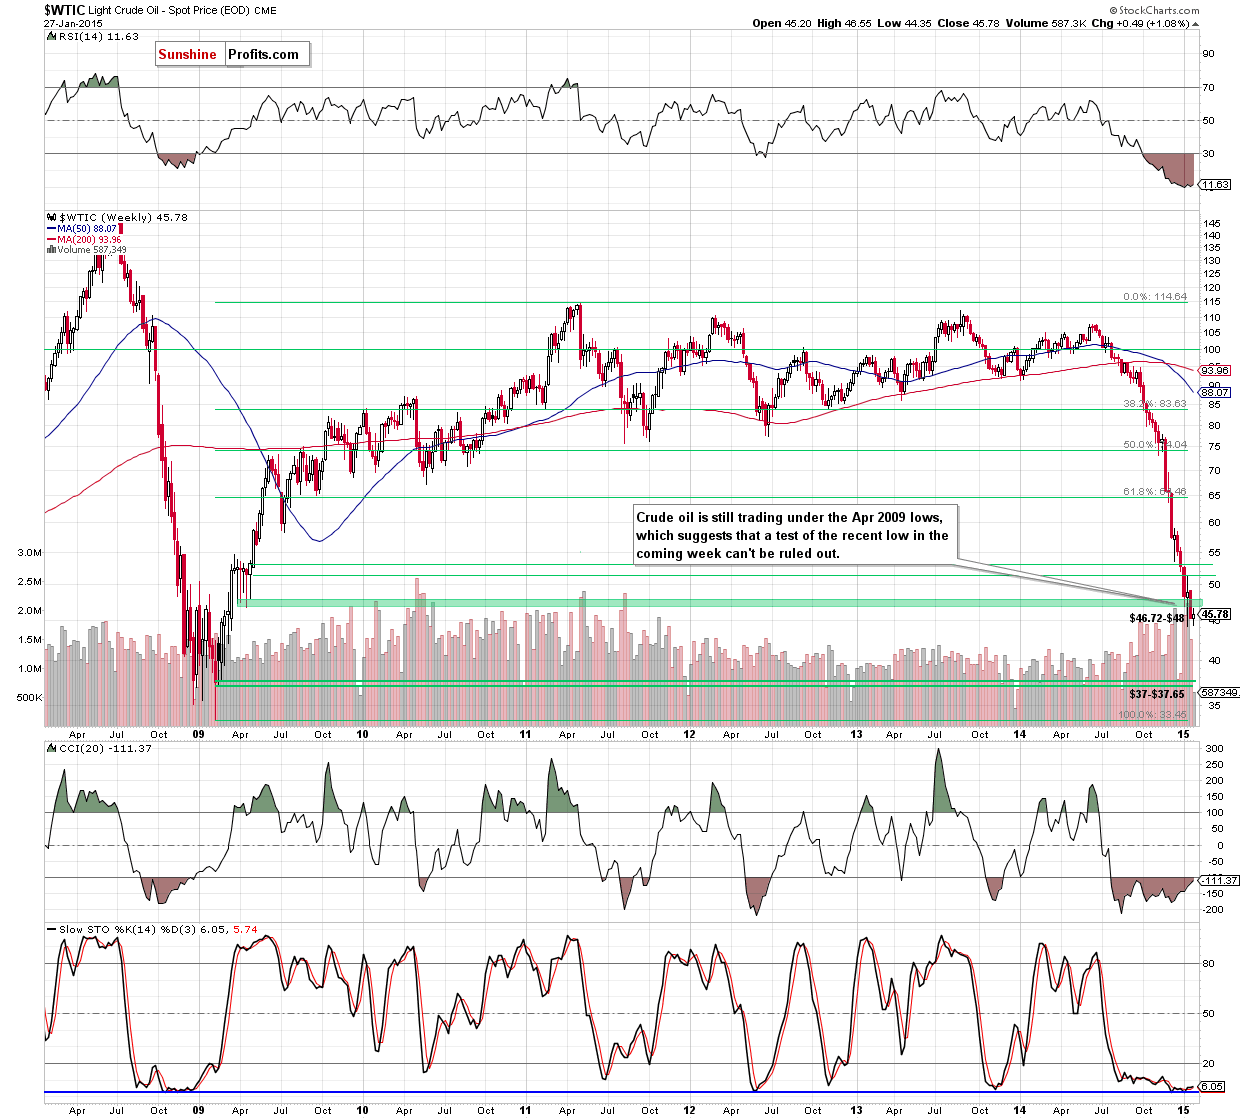
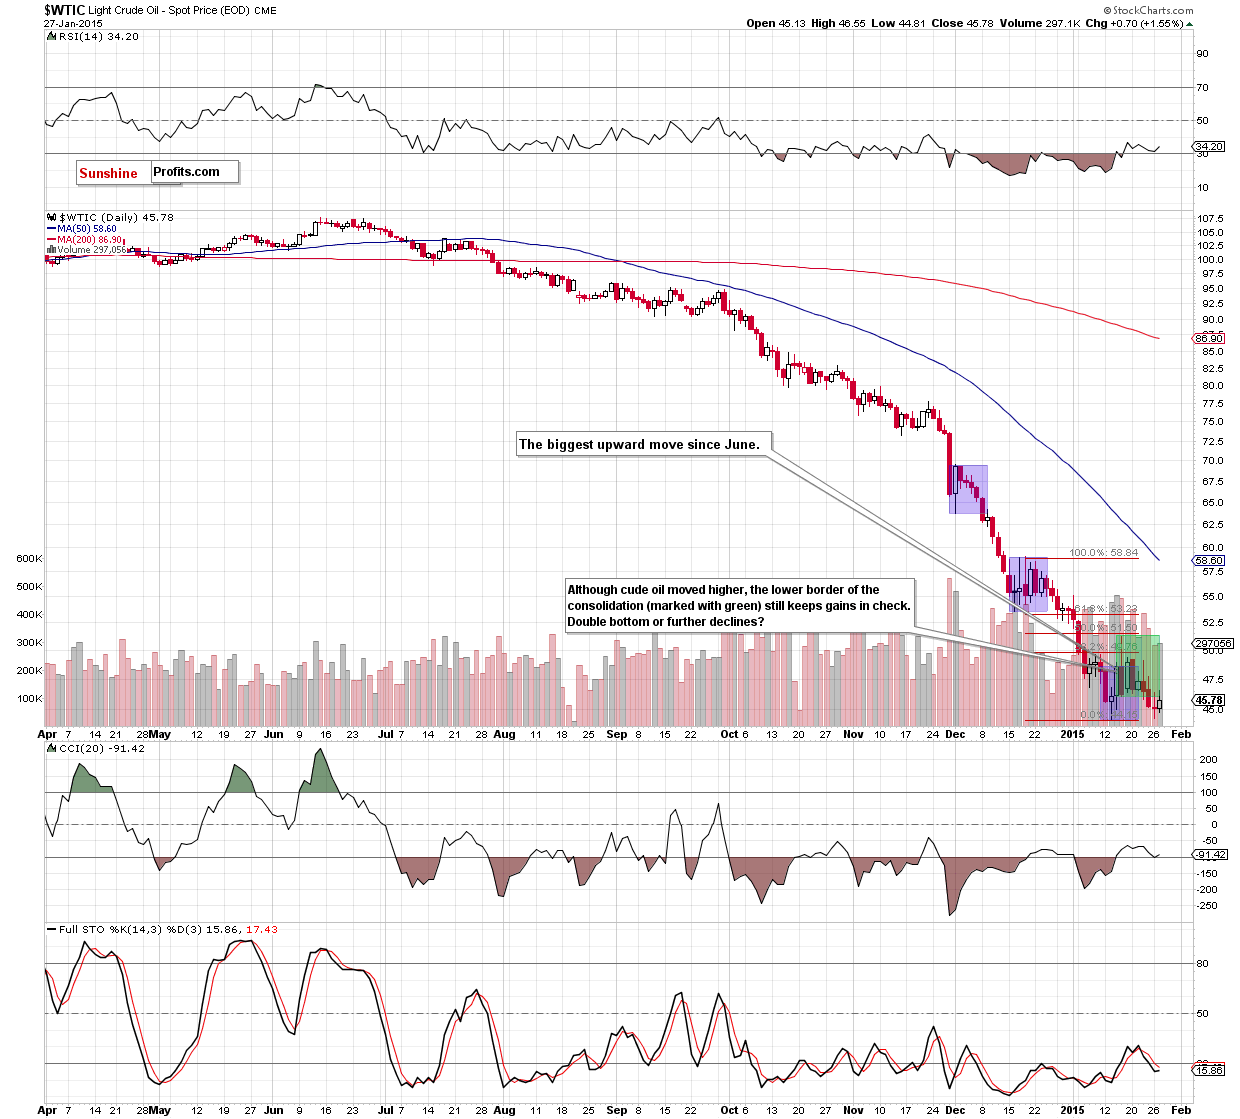
As you see on the above charts, although crude oil bounced off the recent lows and moved little higher, the commodity is still trading under the resistance zone created by the previously-broken lower border of the consolidation (marked with green on the daily chart) and the Apr 2009 lows, which keeps gains in check. Taking this fact into account, we believe that what we wrote in our previous Oil Trading Alert is up-to-date:
(…) a breakdown below the lower border of the consolidation (marked with green), (…) is a bearish signal that suggests further deterioration in the coming day(s). At this point, it’s worth noting that we saw similar situations several times in the previous months (we marked them with blue). Back then, after short-lived consolidation, the commodity broke under the lower line of the formation, which triggered further deterioration and resulted in fresh, multi-month lows. (…) Taking all the above into account, and combining it with the medium-term picture (the commodity is still trading under the Apr 2009 lows), we believe that lower values of light crude and a test of the recent low are likely.
At this point some of you may ask when the situation will improve. In our opinion, a trend reversal (and an upward move to the Dec highs around $60) will be likely only if we see a breakout above the solid resistance zone (created by the previously-broken 76.4% and 78.6% Fibonacci retracement levels marked with green on the weekly chart and the 50% Fibonacci retracement based on the mid-Dec-Jan decline), which won’t be followed by a fresh low. Until this time, the above-mentioned bearish scenario is still in play.
Before we summarize today’s alert we would like to draw your attention to yesterday’s API data, which showed that crude oil inventories increased by 12.7 million barrels last week, while distillate stocks fell 670,000 barrels and gasoline stocks dropped by 5 million barrels. If today’s EIA report confirms these numbers, oil bears will have an additional argument to push the commodity lower and test the strength of the recent lows. On the other hand, if today’s numbers are bullish, we’ll see another attempt to come back above $47-$48 per barrel (the Apr 2009 lows) later in the day.
Summing up, although crude oil moved higher once again, yesterday’s upswing didn’t change the overall situation as the commodity is still trading not only well below the 50% Fibonacci retracement based on the mid-Dec-Jan decline, but also under the lower border of the consolidation. This suggests that as long as these levels are in play, another downswing and a test of the recent low can’t be ruled out.
Very short-term outlook: mixed with bearish bias
Short-term outlook: mixed
MT outlook: mixed
LT outlook: bullish
Trading position (short-term; our opinion): No positions are justified from the risk/reward perspective at the moment, but we will keep you informed should anything change.
Thank you.
Nadia Simmons
Forex & Oil Trading Strategist
Przemyslaw Radomski, CFA
Founder, Editor-in-chief
Gold & Silver Trading Alerts
Forex Trading Alerts
Oil Investment Updates
Oil Trading Alerts
