
Oil Trading Alert originally sent to subscribers on October 15, 2014, 12:27 PM.
Trading position (short-term; our opinion): No positions.
On Tuesday, crude oil lost 3.18% after the International Energy Agency cut its forecasts for oil-demand growth this year and next. As a result, light crude dropped below the support zone and slipped to the next long-term support line. How low is too low?
Yesterday, the International Energy Agency in its monthly oil market report cut its forecast for 2014 oil-demand growth by 200,000 barrels a day from its September report to just 700,000 barrels a day. The IEA added also that the OPEC pumped more oil last month than it has in 13 months, while non-OPEC producers added 2.1 million barrels a day in the period, or more than 2% of global daily demand, which watered down the price of the commodity.
Additionally, weak European economic data also weighed on the price. The ZEW Centre for Economic Research showed that its German economic sentiment index dropped to -3.6 this month from September’s 6.9 reading. On top of that, the index of euro zone economic sentiment plunged to 4.1 in September from 14.2 in August, while year-on-year, industrial production fell 1.9% in August. The combination of these two bearish fundamental factors pushed crude oil to its lowest level since June 2012. Has the commodity got further room to fall?(charts courtesy of http://stockcharts.com).
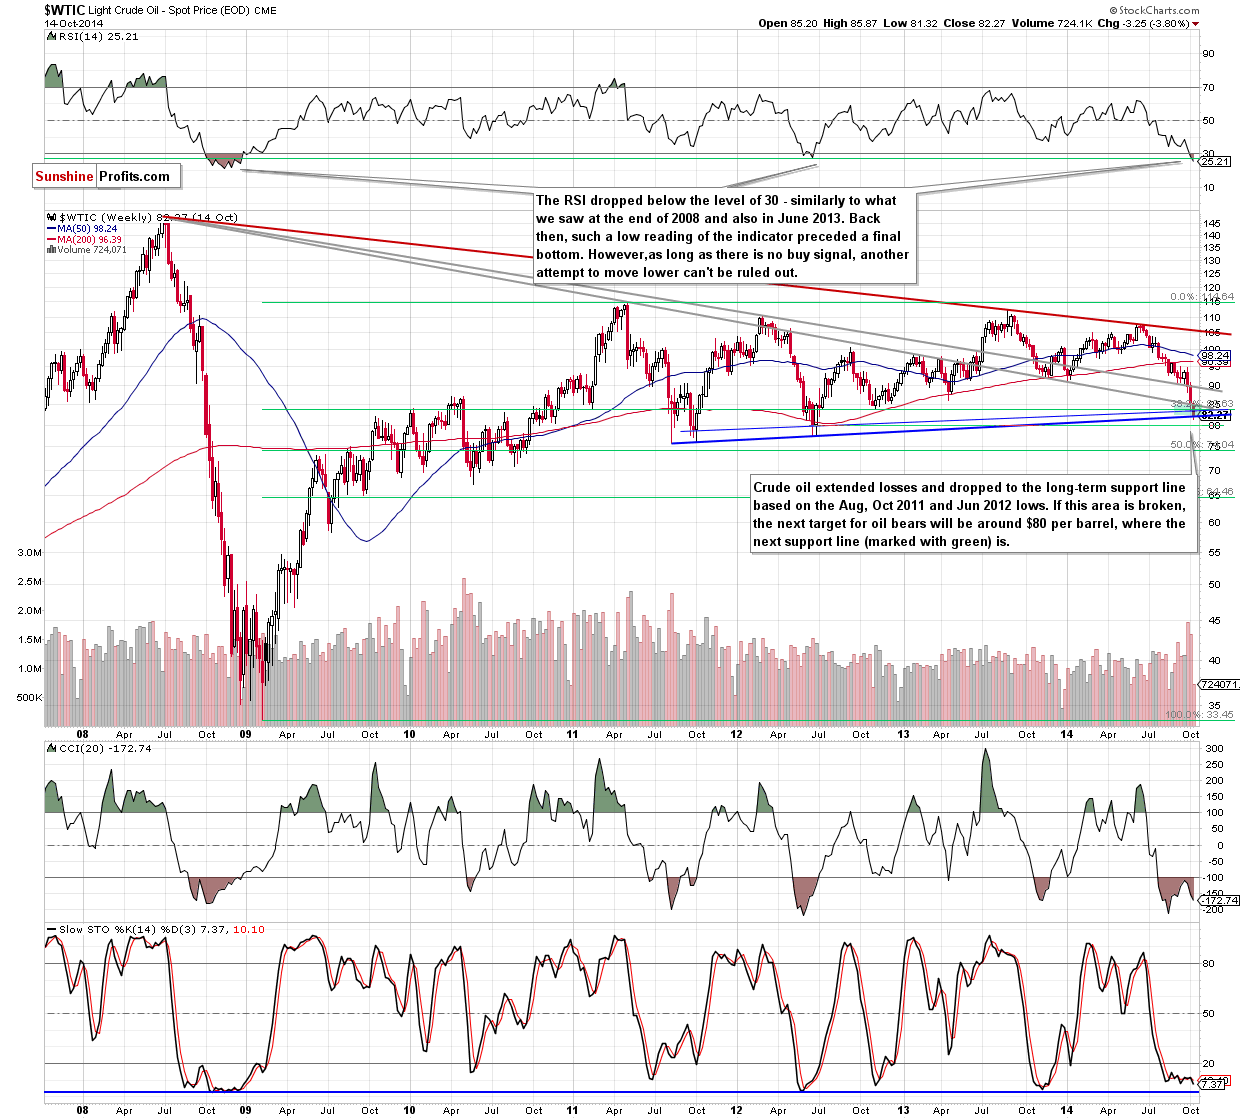
As we have pointed out before, the combination of strong fundamental factors pushed the commodity lower. As a result, crude oil broke below the lower long-term support line once again, which accelerated the declines. With this downward move, light crude slipped below the long-term blue support line based on the Aug 2011, Oct 2011 and Jun 2012 lows, but finally closed the day slightly above it. This is a positive sign, however, taking into account the size of the downswing it’s hard to say that this is a bullish signal. Therefore, we should take into account the possibility of further declines. How low could the commodity go? As you see on the above chart, the initial target for oil bears would be around $80 per barrel, where the next support line is. If it is broken, we could see a drop even to $77.28, where the Jun 2012 low is.
Summing up, the most important event of yesterday’s session was another breakdown below the long-term support line, which is a strong bearish signal. Therefore, another move lower can’t be ruled out. Taking into account the proximity to the next support lines, it seems that the space for further declines is limited. Nevertheless, as long as there is no signs (such as buy signals or invalidation of the key resistance zone) that the declines could be over, we think that staying on the sidelines and waiting for the confirmation that the final bottom is in is the best choice at the moment.
Very short-term outlook: mixed
Short-term outlook: mixed
MT outlook: mixed
LT outlook: bullish
Trading position (short-term; our opinion): No positions.
Thank you.
Nadia Simmons
Forex & Oil Trading Strategist
Przemyslaw Radomski, CFA
Founder, Editor-in-chief
Gold & Silver Trading Alerts
Forex Trading Alerts
Oil Investment Updates
Oil Trading Alerts
