
Oil Trading Alert originally sent to subscribers on September 29, 2014, 8:35 AM.
Trading position (short-term; our opinion): Long positions with a stop-loss order at $89 are justified from the risk/reward perspective. Initial price target: $96.
On Friday, crude oil gained 1% as the upbeat U.S. GDP report and geopolitical events pushed the price up. As a result, light crude climbed above $93 once again and broke its key resistance line. Is it time for further rally?
On Friday, the Commerce Department reported that U.S. gross domestic product expanded at an annual rate of 4.6% in the second quarter, while GDP was initially reported to have increased by 4.2%. These positive numbers, fueled hopes that an expanding U.S. economy will consume more fuel and energy, which was supportive for the commodity. On top of that, reports that a U.S.-led airstrikes targeting ISIS position have hit oil facilities in Syria raised concerns that exports from the region will be affected and pushed crude oil above $93 per barrel. Will we see further rally? (charts courtesy of http://stockcharts.com).
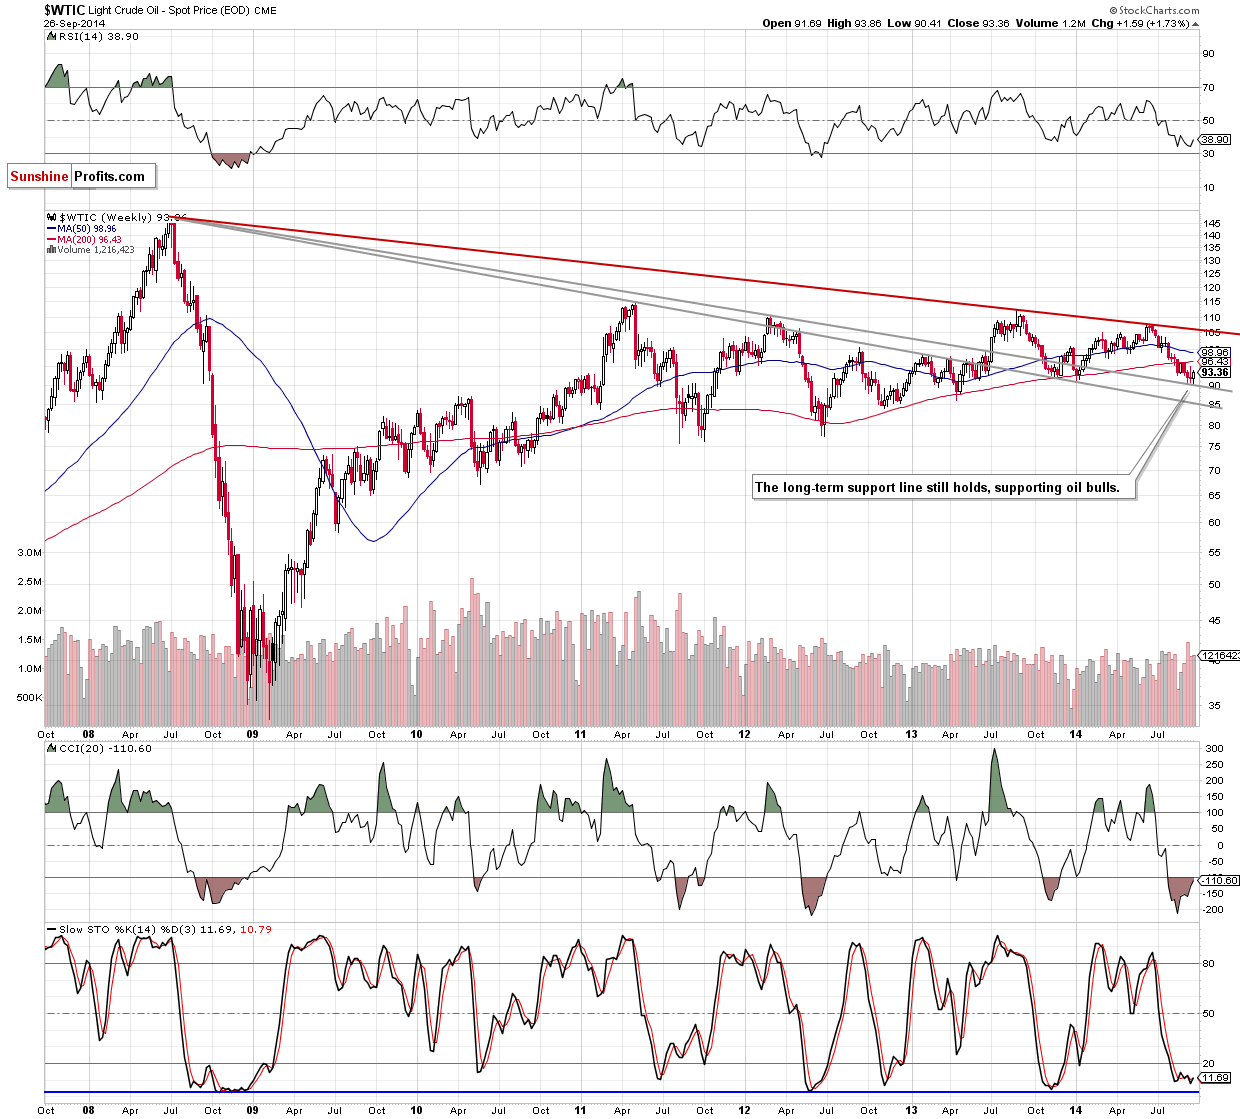
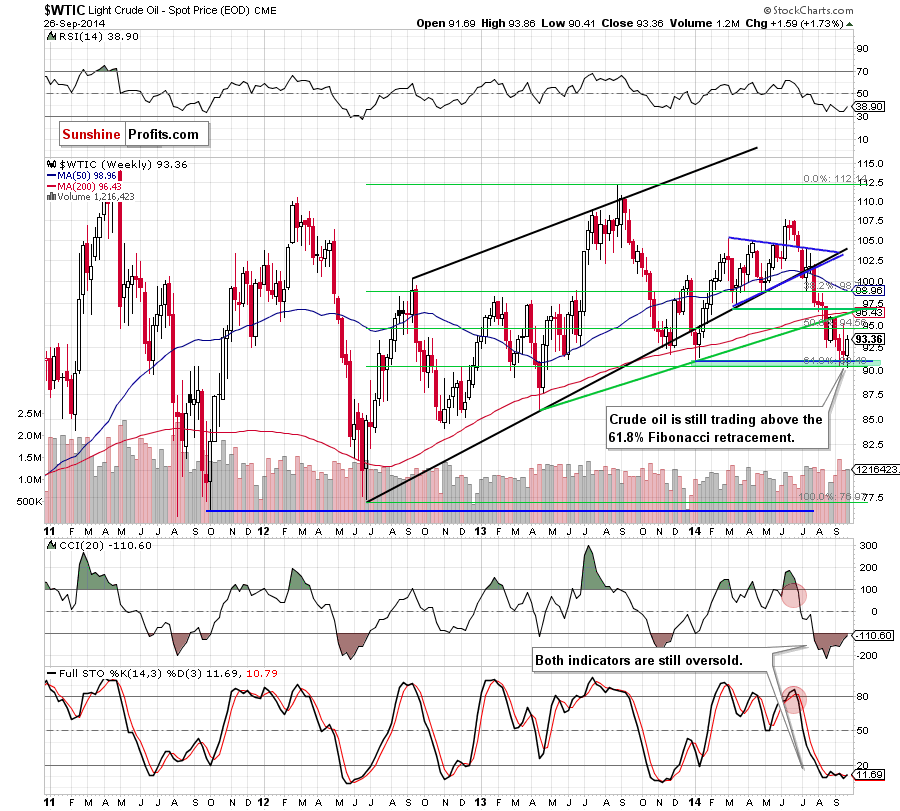
Looking at the above charts we see that the situation in the medium term has improved as crude oil extended rally and moved away from the strong support zone created by the long-term declining support line and the 61.8% Fibonacci retracement. Taking this positive sign into account, we think that oil bulls will try to break above the last week’s high of $95.19 and test the strength of the resistance zone created by the green support/resistance line and the previously-broken 200-week moving average (currently around $96.40).
How did this increase change the very short-term picture? Let’s check.
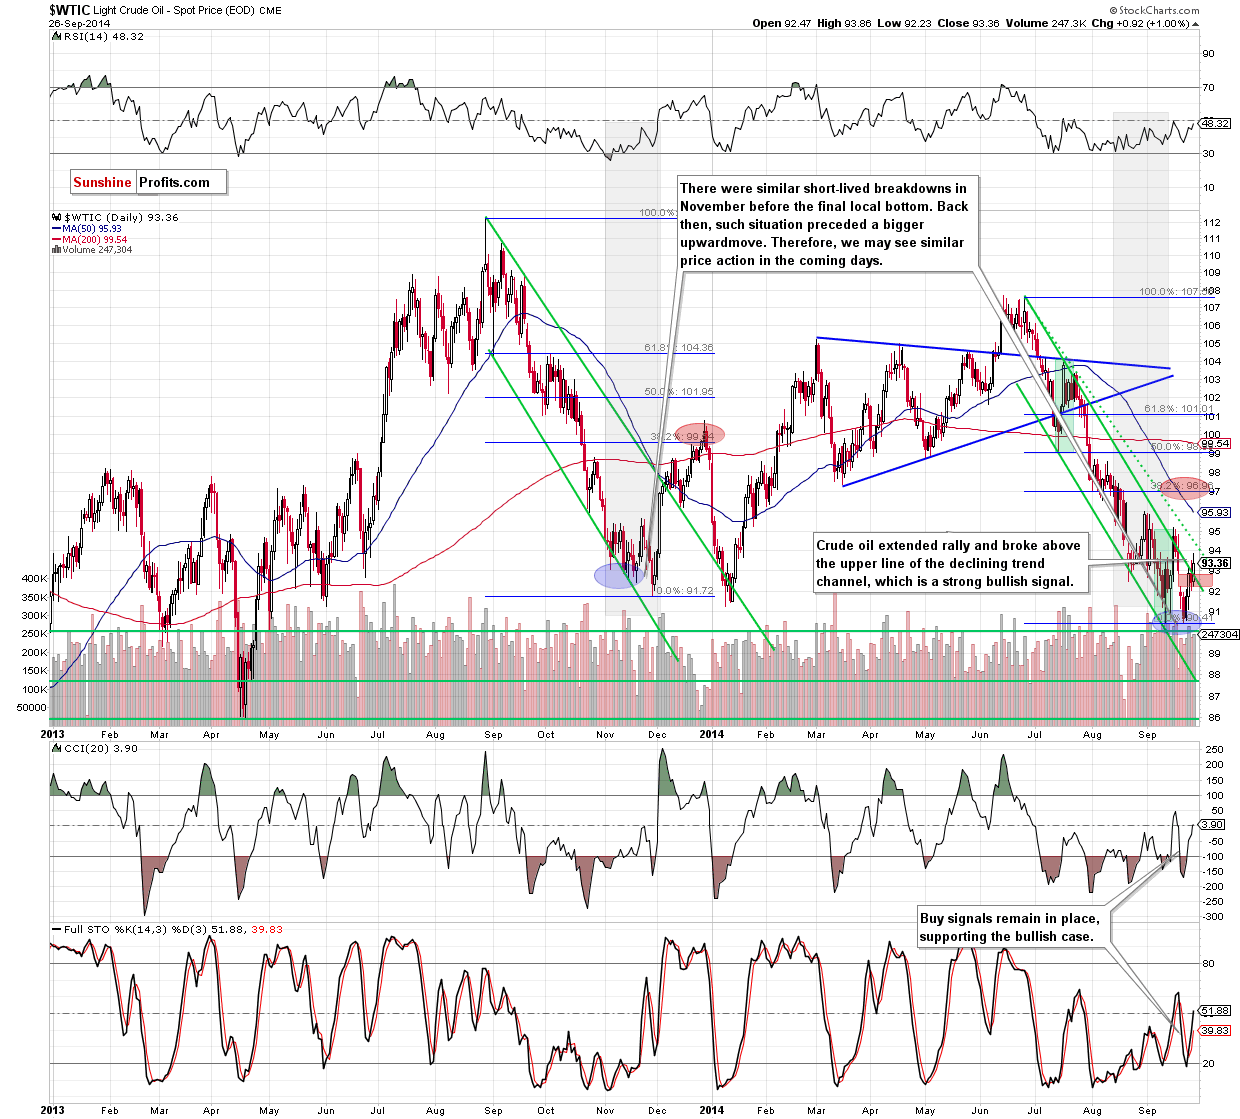
The first thing that catches the eye on the daily chart is a breakout above the upper line of the declining trend channel (this time the commodity also closed the day above this key resistance line), which is a strong positive signal. Although the breakout is not confirmed by three consecutive closures at the moment, buy signals generated by the indicators remain in place, supporting the bullish case. What’s next? If the breakout is not invalidated, we’ll see further improvement and an increase to at least $95.19, where the Sep 16 high is. If this resistance is broken, the next upside target for oil bulls will be around 96$, where the 50-day moving average intersects the resistance level based on the Aug 29 high.
Summing up, the highlight of Friday’s session was a breakout above the upper line of the declining trend channel, which is a strong bullish signal. Taking this fact into account and combining it with buy signals generated by the indicators, we are convinced that keeping long positions is justified from the risk/reward perspective.
Very short-term outlook: bullish
Short-term outlook: mixed with bullish bias
MT outlook: mixed
LT outlook: bullish
Trading position (short-term; our opinion): Long with a stop-loss order at $89. We will keep you informed should anything change, or should we see a confirmation/invalidation of the above.
Thank you.
Nadia Simmons
Forex & Oil Trading Strategist
Przemyslaw Radomski, CFA
Founder, Editor-in-chief
Gold & Silver Trading Alerts
Forex Trading Alerts
Oil Investment Updates
Oil Trading Alerts
