
Oil Trading Alert originally sent to subscribers on July 16, 2014, 8:59 AM.
Trading position (short-term; our opinion): In our opinion no positions are justified from the risk/reward perspective.
On Tuesday, crude oil hit a fresh two-month low of $99.01 as an improving picture for global supplies weighed on the price. Although the commodity was trading below the psychological barrier of $100 for the first time since May, light crude rebounded after a drop to the support zone. Could it stop oil bears’ charge?
Yesterday, the oil market received further confirmation that Libya's oil production is bouncing back as the country's National Oil Corp. said that production had risen to more than 550,000 barrels a day, beating earlier expectations. Nevertheless, fighting between government forces and rebels around the airport in the capital of Tripoli, caused that it’s still unclear when exports would resume.
Another bearish factor for crude oil was news from Vienna, where the U.S. and Iran reported progress on talks to rein in Iran's nuclear program. Please note that an agreement could lead to the possible lifting of severe sanctions on Iran that have curtailed oil exports and add more barrels to the global market.
Despite these bearish factors, crude oil rebounded as Federal Reserve Chair Janet Yellen said in her testimony that although the recovery is not yet complete, the economy is continuing to improve, which boosted the demand outlook. Are there any encouraging technical signs on the horizon that could push the price higher in the nearest future? Let’s check the charts below and look for answer (charts courtesy of http://stockcharts.com).
Yesterday, we wrote the following:
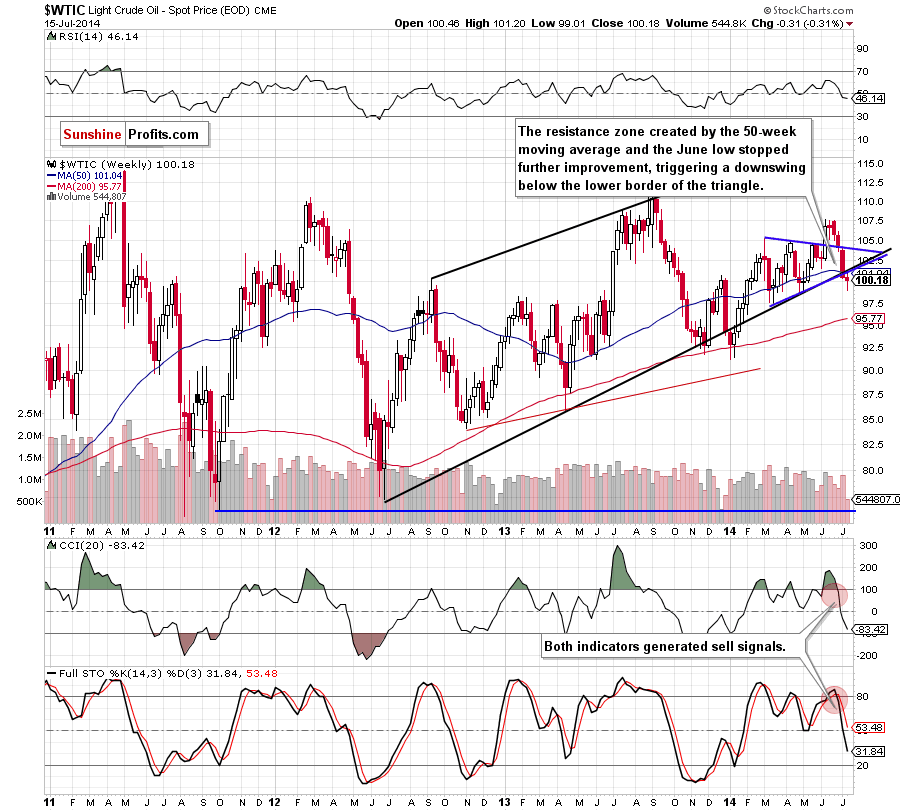
(…) the commodity still remains below the resistance zone created by the June low and the 50-week moving average, while sell signals generated by the indicators favors oil bears. Therefore, in our opinion, as long as there is no visible move above this area, another attempt to move lower can’t be ruled out.
Looking at the situation in the medium term, we see that the above-mentioned resistance zone successfully stopped further improvement, encouraging investors to push the sell button. In this way, crude oil declined below the lower border of the blue triangle once again. Although light crude moved little higher after a drop to its nearest support area, the commodity still remains below the medium-term resistance line. Therefore, as long as there is no an invalidation of the breakdown (and visible move above the June low and the 50-week moving average), another attempt to test the strength of the support zone is likely – especially when we factor in sell signals generated by the indicators.
Once we know the above, let’s examine the very short-term picture. Will it give us more clues about future moves?
Quoting our previous Oil Trading Alert:
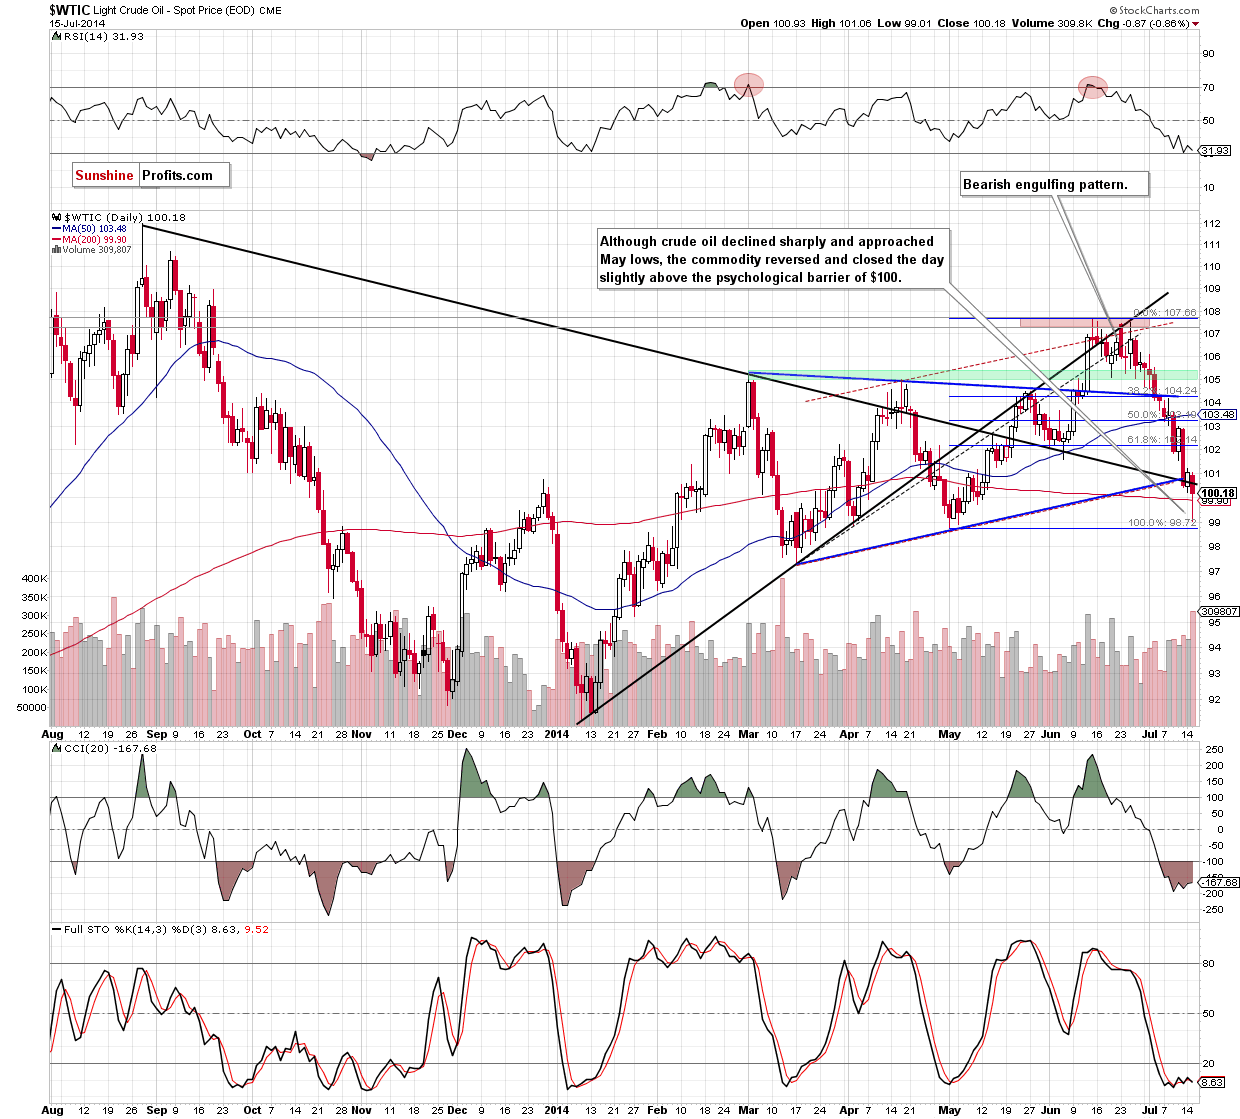
(…) taking into account the size of yesterday’s move (it’s smaller than Thursday increase, not to mention the corrective upswing that we saw between June 19 and June 25) and the medium-term picture, we are skeptical and think that we’ll see another attempt to drop below the key-level of $100 in the nearest future. Please note that if this important support is broken, the commodity will correct to at least $99.92, where the 200-day moving average is.
From the daily perspective, we see that oil bears not only realized the above-mentioned scenario, but also pushed the price to around May lows. As you see on the above chart, this support area encouraged some traders to buy crude oil or to simply bet on its rebound (it seems to us that such a bet is too risky at this time, as the coming rally will likely be quite small). As a result, crude oil rebounded and came back above the 200-day moving average and the psychological barrier of $100. Although this is a positive sign, we think that as long as light crude remains under the long- and medium-term resistance lines, we should treat all corrective upswings as nothing more than a verification of the breakdown. In our opinion, the very short-term outlook will improve only if we see an upward move similar (or bigger) to the one that we saw between June 19 and June 25.
Will we see a move higher in the coming days? Considering the shape of yesterday's candlestick, and the place where it appeared, it’s quite likely. Thanks to the corrective upswing from the support zone, it has a long lower shadow, which clearly indicates the importance of this area for oil bulls and suggests that their opponents should have a tough time breaking through it. At this point, it’s worth noting that a similar situation from the beginning of September resulted in a bigger corrective upward move. Taking this fact into account and combining it with the current position of the indicators (the CCI and Stochastic Oscillator are overbought, while the RSI remains slightly above the level of 30), it seems to us that a pause or correction in short term is just around the corner.
Summing up, crude oil extended losses and tested the strength of a psychologically important level of $100. Although light crude slipped below this key level, the support zone created by May lows stopped further deterioration and the commodity rebounded, closing the day above it. As we have pointed out before, the shape of yesterday’s candlestick and the current position of the indicators suggests that a pause or correction in short term is just around the corner. Therefore, if crude oil climbs above both resistance lines, we’ll see a corrective upswing to at least $102.30, where the 38.2% Fibonacci retracement (based on the entire recent decline) is. Nevertheless, as long as the commodity is trading below its nearest resistance, another drop to around May lows can’t be ruled out. Taking all the above into account, we think that the current situation is too unclear to open any positions as light crude might go both north and south from here. Therefore, it seems that the most appropriate way to dispel doubts will be keep an eye on today's crude oil’s behavior after the EIA weekly report and read our next Oil Trading Alert.
Very short-term outlook: mixed
Short-term outlook: mixed with bearish bias
MT outlook: mixed
LT outlook: mixed
Trading position (short-term): No positions are justified from the risk/reward perspective at the moment. We will keep you informed should anything change, or should we see a confirmation/invalidation of the above.
Thank you.
Nadia Simmons
Forex & Oil Trading Strategist
Przemyslaw Radomski, CFA
Founder, Editor-in-chief
Gold & Silver Trading Alerts
Forex Trading Alerts
Oil Investment Updates
Oil Trading Alerts
