
Oil Trading Alert originally sent to subscribers on April 23, 2014, 11:27 AM.
Trading position (short-term; our opinion): No positions are justified from the risk/reward perspective.
On Tuesday, crude oil lost 1.78% as concerns over another build in U.S. crude oil inventories overshadowed ongoing fears over tensions between Russia and Ukraine. Because of these circumstances, light crude declined sharply and invalidated the breakout above the medium-term resistance line. Will this strong bearish signal trigger further deterioration in the coming days? Which important support could stop sellers?
Last Wednesday, the Energy Information Administration showed in its weekly report that U.S. crude oil inventories rose by 10.01 million barrels in the week ended April 11 and stood just 3.4 million barrels below the peak reached in May 2013. Additionally, it was the biggest one-week build in crude oil supplies in 13 years. Therefore, expectations for another build in domestic stockpiles encouraged oil investors to close their long positions and jump to the sidelines ahead of today’s report on crude oil inventories. In reaction to this, light crude moved sharply lower and closed the day below $102 for the first time since Apr.7.
Having discussed the above, let’s move on to the technical changes in the crude oil market (charts courtesy of http://stockcharts.com.)
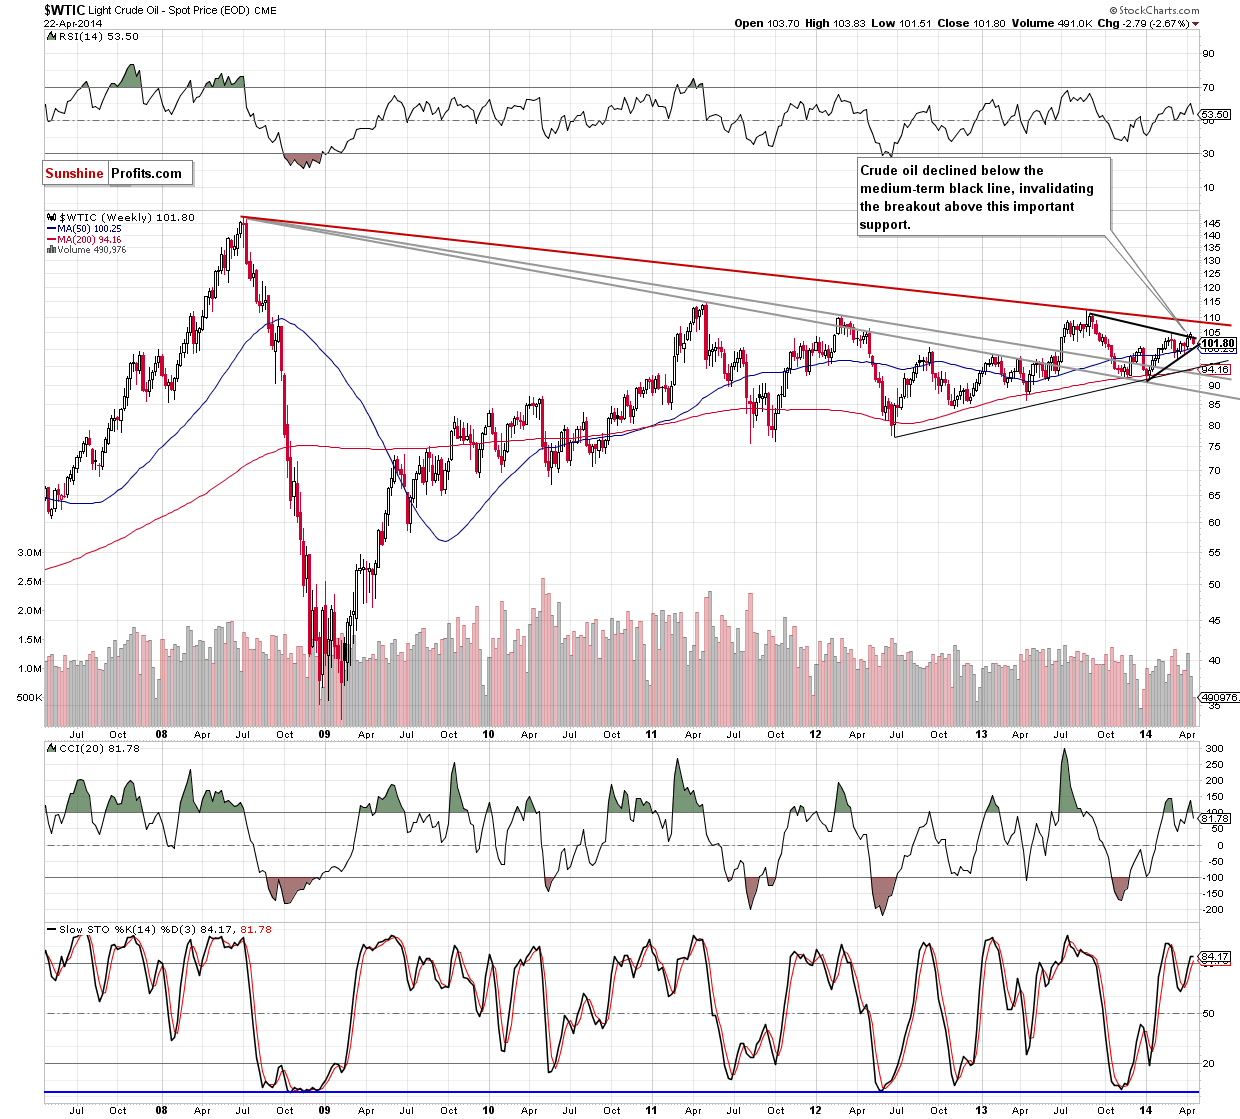
As you see on the weekly chart, the situation has deteriorated as crude oil gave up the gains and declined below the medium-term resistance line (marked with black). With this move, the commodity invalidated the breakout above this support line, which is a bearish signal. Taking this fact into account, it seems that we may see further deterioration and the downside target for the sellers will be the lower line of a triangle, which corresponds to the 50-week moving average at the moment (around $100.25).
Having disscussed the above, let’s zoom in on our picture and move on to the daily chart.
In our previous Oil Trading Alert, we wrote the following:
(…) if the buyers fail, we may see a drop below the upper border of the rising trend channel, which will likely trigger a decline to the medium-term black line (currently around $103.50).
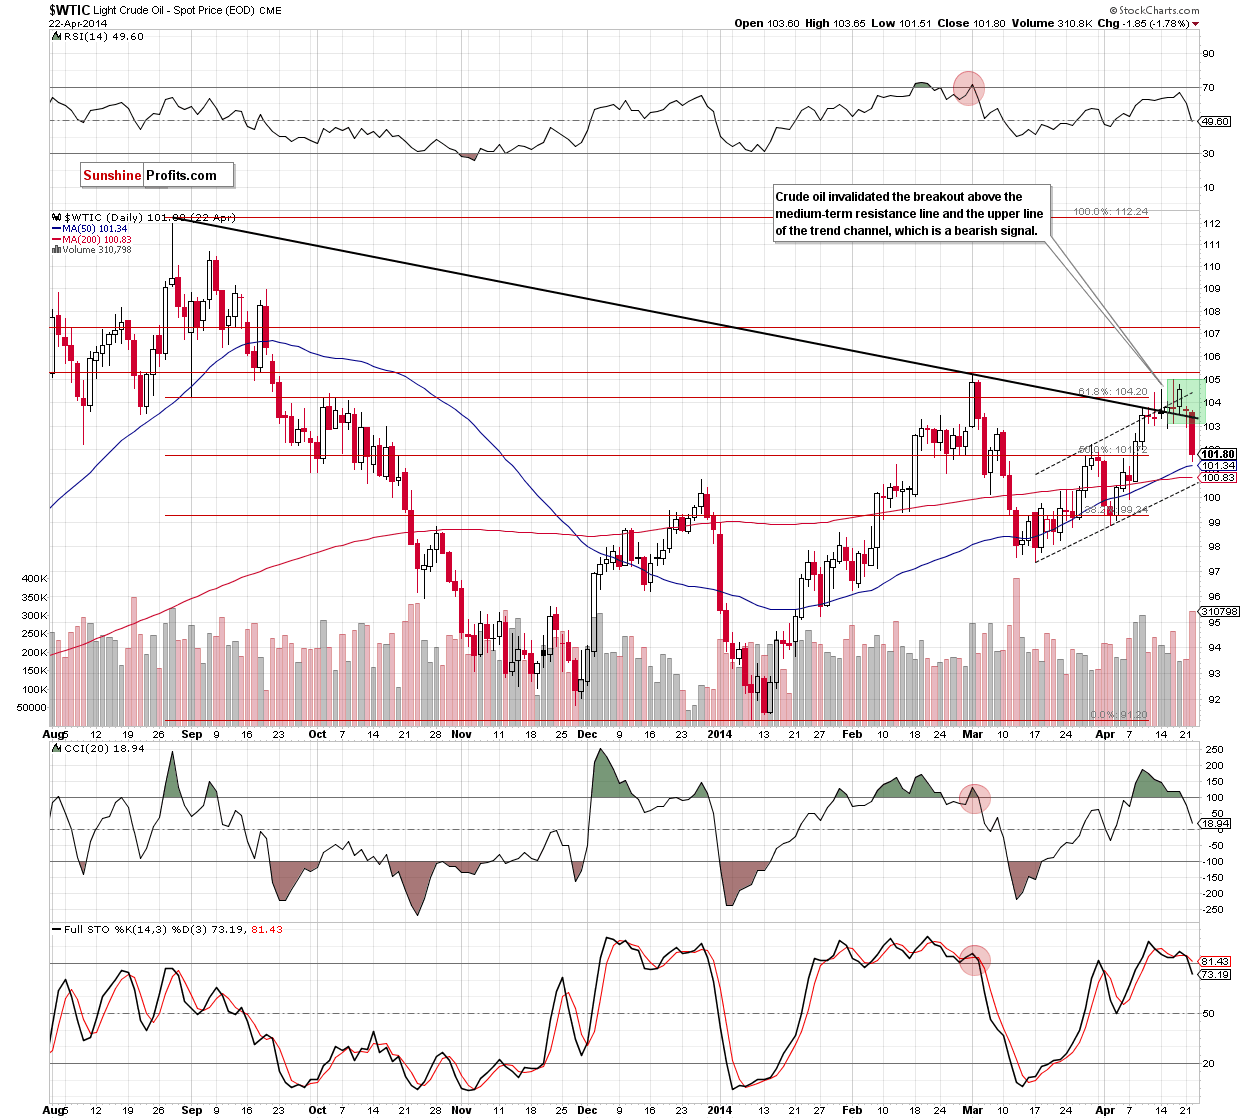
Looking at the above chart, we see that oil bulls didn’t manage to hold gained levels, which resulted in a sharp decline. With this downswing crude oil dropped not only below the upper border of the rising trend channel, but also under the medium-term support line. In this way light crude invalidated the breakout above it, which was a strong bearish signal that accelerated further declines.
As you see at the daily chart, the commodity also dropped below the lower line of the consolidation (marked with green). According to theory such price action may trigger a decline to around $101.30. Yesterday, oil bears almost realized this scenario as crude oil hit an intrady low of $101.51. At this point it’s worth noting, that slightly below this level is the 50-day moving average, which serves as the nearest support at the moment (at $101.34). If it holds and encourages buyers to act, we may see a corrective upswing in the coming day (or days). However, if it is broken, the next downside target for the sellers will be the 200-day moving average (currently at $100.83).
Before we summarize today’s Oil Trading Alert, we would like to draw your attention to two important bearish signs. Firstly, yesterday's decline materialized on large volume, which confirms the strength of the sellers. Secondly, the CCI and Stochastic Oscillator generated sell signals. Taking these facts into account, it seems that another attempt to move lower should not surprise us.
Summing up, the most significant event of yesterday's session was an invalidation of the breakout above the medium-term support/resistance line. An invalidation of the breakout is a strong bearish signal, which suggests that further deterioration is likely to be seen in the near future (especially when we factor in the size of the volume that we saw yesterday and sell signals generated by the indicators). If this is the case, the first downside target for the sellers will be around $100.83-$101.34, where the 50-day and 200-day moving averages are. If this area is broken, the next price target will be the lower line of a triangle (currently around $100.25). If this strong support is broken, we’ll consider opening short positions.
Very short-term outlook: mixed with bearish bias
Short-term outlook: mixed with bearish bias
MT outlook: mixed
LT outlook: mixed
Trading position (short-term): In our opinion no positions are justified from the risk/reward perspective. We will keep you informed should anything change, or should we see a confirmation/invalidation of the above.
Thank you.
Nadia Simmons
Forex & Oil Trading Strategist
Przemyslaw Radomski, CFA
Founder, Editor-in-chief
Gold & Silver Trading Alerts
Forex Trading Alerts
Oil Investment Updates
Oil Trading Alerts
