
Oil Trading Alert originally sent to subscribers on April 7, 2014, 12:34 PM.
Trading position (short-term; our opinion): Short. Stop-loss orders for crude oil and also for WTI Crude Oil (CFD): $102.95.
Crude oil gained 0.63% on Friday as solid jobs report and doubts over the oil export from Libya pushed the price higher. In this way, light crude broke above an important resistance level and closed the day above $101 per barrel. Will crude oil extend gains in the near future? If you want to know our take on this question, we invite you to read our today's Oil Trading Alert.
On Friday, crude oil moved higher after the Labor Department showed that the U.S. economy added 192,000 jobs in March. Although the data slightly missed expectations (analysts had expected an increase of 200,000 jobs), oil investors were encouraged by the fact that job growth could fuel demand for petroleum products in the largest oil-consuming nation. Friday’s report also showed that the unemployment rate remained unchanged at 6.7% in the previous month (also below expectations for a drop to 6.6%).
As mentioned earlier, another bullish factor was the situation in Libya, where armed protestors could agree to reopen blockaded export terminals within days. However, as hopes that oil ports may begin shipments soon faded, the price of crude increased above $101 per barrel. Despite these circumstances, crude oil posted its first weekly loss in three weeks.
Having discussed the above, let’s move on to the technical changes in the crude oil market (charts courtesy of http://stockcharts.com.)
In our last Oil Trading Alert, we wrote the following:
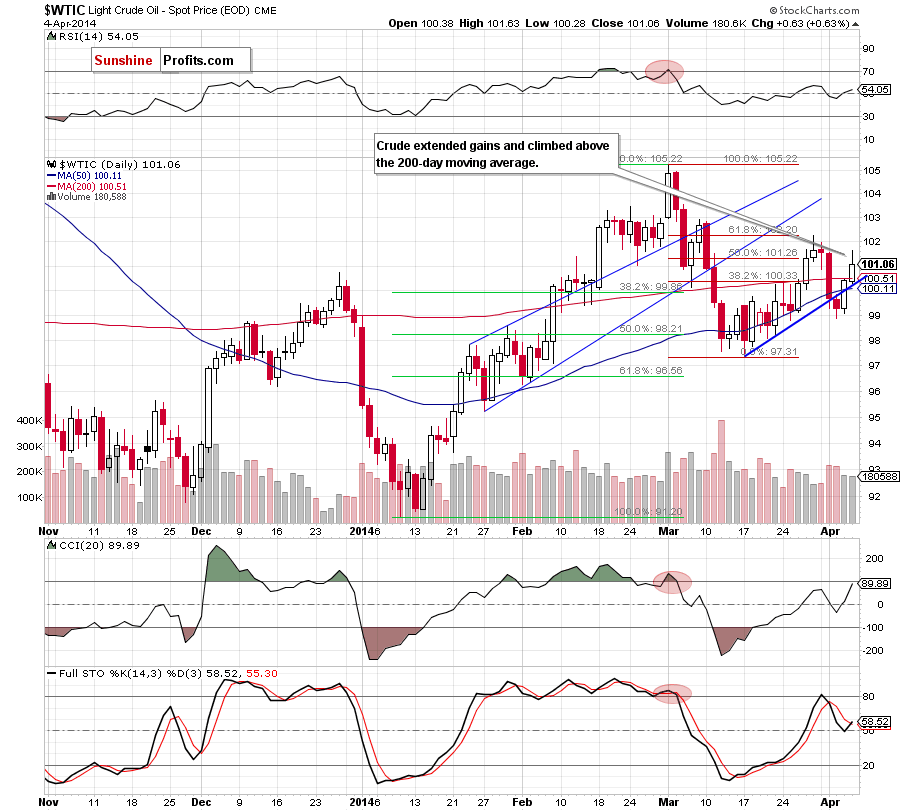
(…) light crude reached the 200-day moving average, which is the major resistance at the moment. If it holds, we will likely see a pullback in the coming day (the nearest support is the blue support line, which intersects the 50-day moving average and the next one is Wednesday’s low). However, if it is broken, the next upside target for oil bulls will be around $101.57, where the Apr. 1 high is.
On the above chart, we see that crude oil bounced off the blue support line and broke above the 200-day moving average, which was a bullish signal that triggered further improvement and an increase to the Apr. 1 high. Despite these positive circumstances, light crude reversed and gave up some gains. Additionally, the upswing materialized on relative small volume, which suggests that the buyers are not as strong as it seems at the first glance. Therefore, if the resistance zone created by the March 28 and April 1 highs encourages sellers to act, we will likely see another test of the strength of the blue support line.
Having discussed the current situation in light crude, let’s take a look at WTI Crude Oil (the CFD).
Quoting our previous Oil Trading Alert:
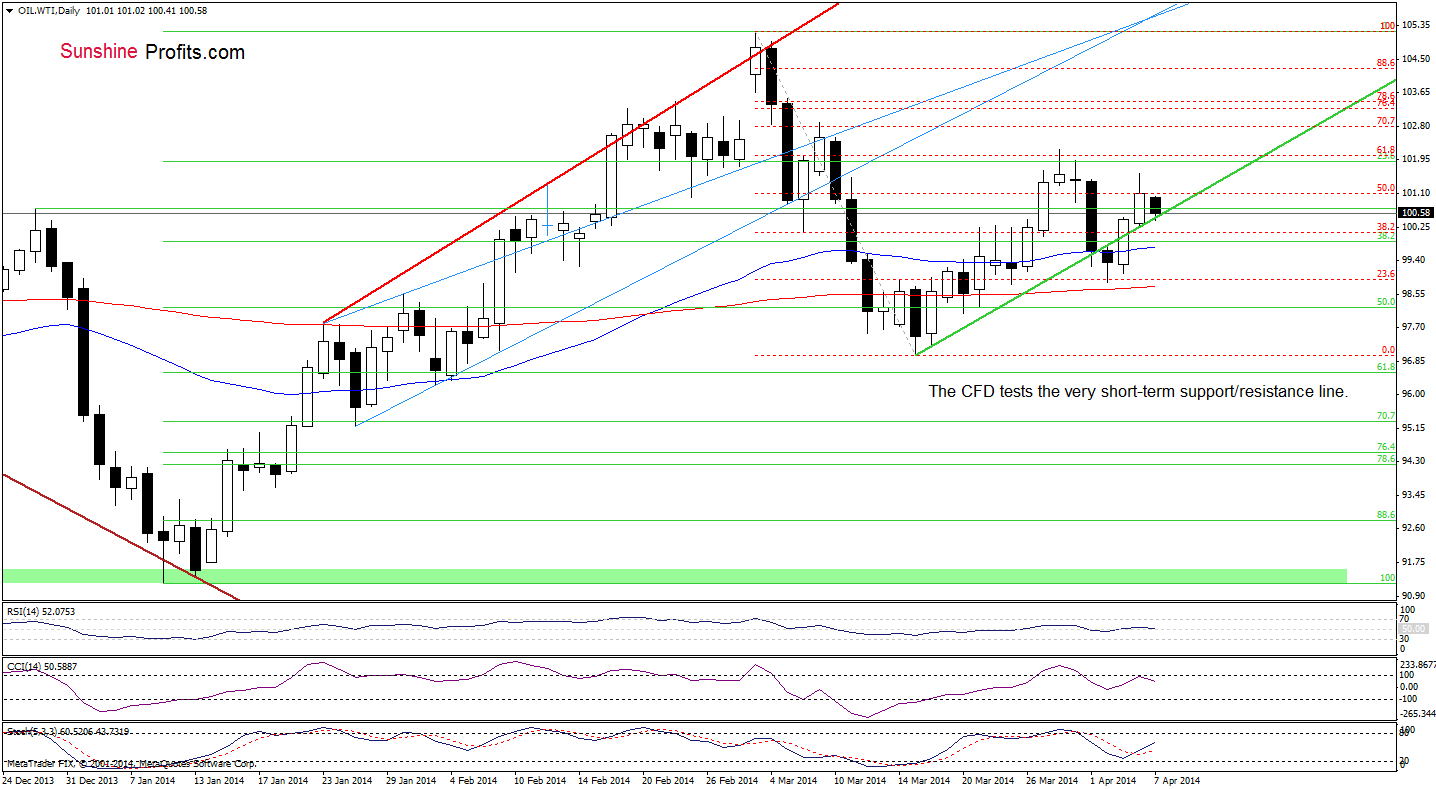
(…) WTI Crude Oil (…) extended gains and approached Tuesday’s high, which serves as the nearest resistance. If it encourages oil bears to act, we will likely see a pullback to the green support line. However, if it is broken, we may see an increase to the March 28 high.
Looking at the above chart, we see that although oil bulls managed to push the price higher, the March 28 high was not reached. This negative event triggered a decline, which took the CFD to the green support line earlier today. If it holds, we may see another attempt to break above the nearest resistance. However, if it is successfully broken (and WTI Crude Oil closes the day below it), we will likely see a pullback to the previously-broken 50-day moving average.
Before we summarize today’s Oil Trading Alert, let’s take a look at the 4-hour chart.
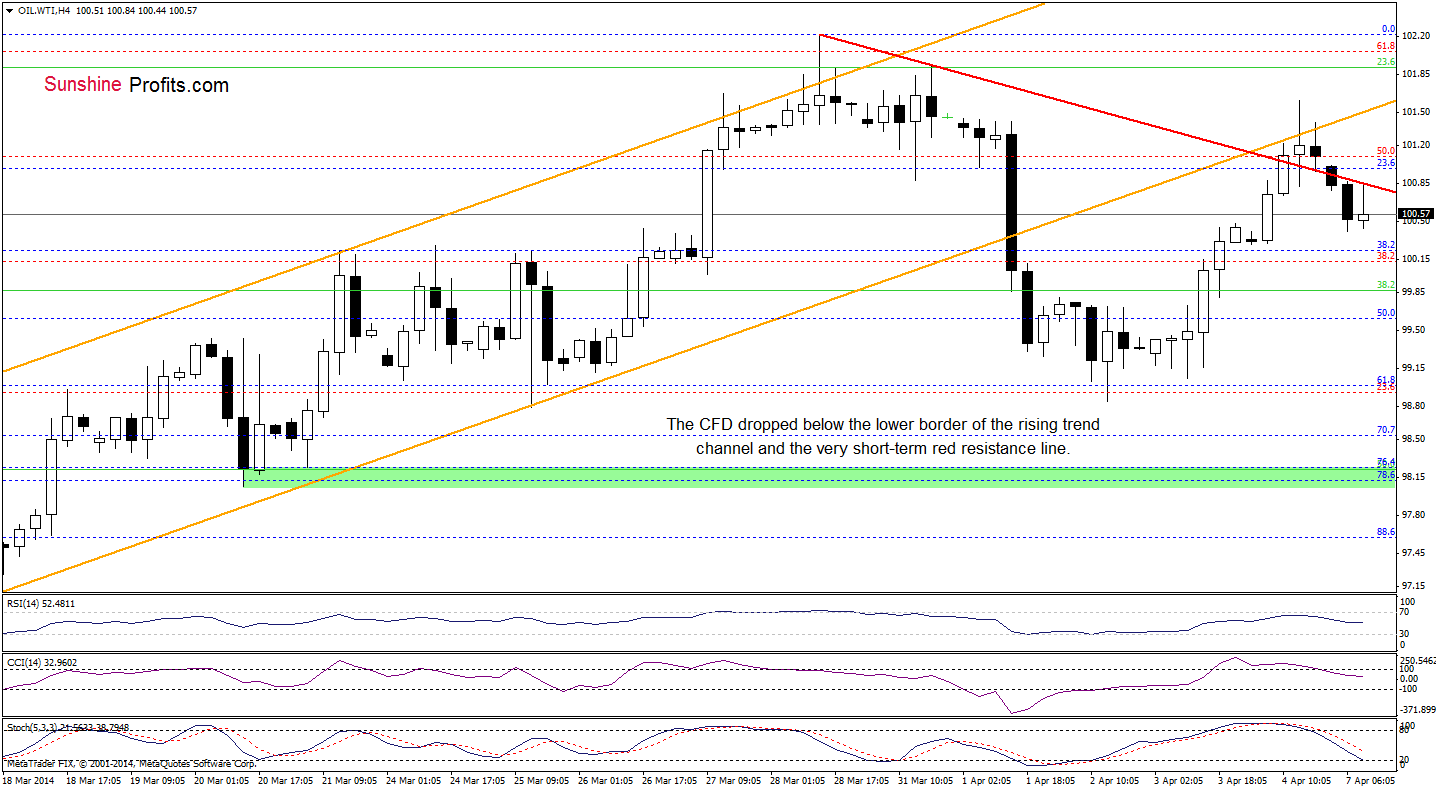
From this perspective, we see that the lower border of the rising trend channel successfully stopped further improvement and triggered a pullback on Friday. Earlier today, the CFD extended losses and dropped below the red declining resistance line based on the recent highs, which is a bearish signal. If this line encourages sellers to act, we will likely see further deterioration and the downside target will be the previously-broken upper line of a consolidation (around $99.72). However, if the buyers do not give up and push the CFD higher, we may see another attempt to break above the orange resistance line.
Summing up, the short-term situation has improved slightly as crude oil came back above the 200-day moving average. Despite this positive fact, the upswing materialized on relative small volume, which suggests that the buyers are not as strong as it seems at the first glance. Please note that we saw similar situation at the beginning of March. Back then, after two days of increases crude oil extended losses and dropped below $98. If history repeats itself once again, we may another decline in the near future.
Very short-term outlook: mixed
Short-term outlook: mixed
MT outlook: mixed
LT outlook: mixed
Trading position (short-term): Short. Stop-loss orders for crude oil and also for WTI Crude Oil (CFD): $102.95. We will keep you informed should anything change, or should we see a confirmation/invalidation of the above.
Thank you.
Nadia Simmons
Forex & Oil Trading Strategist
Forex Trading Alerts
Oil Investment Updates
Oil Trading Alerts
