
Oil Trading Alert originally sent to subscribers on March 12, 2014, 6:44 AM.
Trading position (short-term): Short. Stop-loss orders for crude oil and WTI Crude Oil (CFD): $102.95.
On Wednesday, crude oil lost 1.46% after the EIA showed in its weekly report a much larger-than-expected build in domestic stockpiles. An additional bearish factor which pushed the price lower was an announcement that the U.S. government plans to sell oil from its Strategic Petroleum Reserve. Thanks to this news, light crude dropped to its lowest level since Feb.7, finishing the day slightly above $98 per barrel.
Yesterday, the U.S. Energy Information Administration showed in its weekly report that U.S. crude oil inventories rose by 6.2 million barrels in the week ended March 7 (well above market expectations for a two million barrel increase), which pushed the price below $99. Please note that crude oil supplies have risen for eight straight weeks and stood at 370 million barrels as of last week.
The price of light crude came under additional pressure as the U.S. Department of Energy announced that it plans to sell up to 5 million barrels of sour crude oil out of Strategic Petroleum Reserve sites on the Gulf Coast to test the reserve's capabilities. According to the Energy Department, the most recent reserve drawdown was in 2011, when the department released 60 million barrels of oil to counteract supply disruptions from Libya. The department also loaned 1 million barrels to Marathon Petroleum Company in 2012 after Tropical Storm Isaac.
Having discussed the above, let’s move on to the technical changes in the crude oil market (charts courtesy of http://stockcharts.com.)
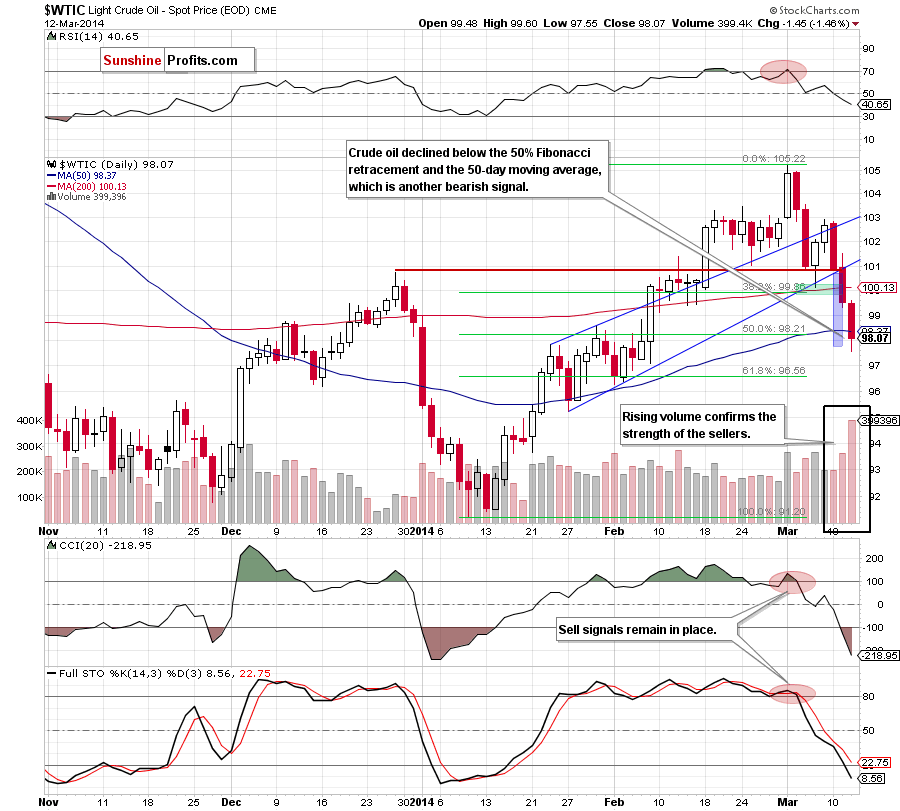
Looking at the above chart, we see that crude oil extended losses and declined below the 50% Fibonacci retracement and the 50-day moving average, reaching its next downside target. However, the most important thing that catches the eye is huge volume - we haven’t seen such value since May 2012. As a reminder, at that time, such an increase in volume preceded a sharp decline, which took the price below $80. Of course it doesn’t mean that we’ll see crude oil at such a low level in the near future, however, it suggests that further deterioration should not surprise us. Please note that the nearest support (and the downside target for oil bears) is the 61.8% Fibonacci retracement around $96.50. As you see on the above chart, sell signals generated by the indicators remain in place supporting sellers.
Having discussed the current situation in light crude, let’s take a look at WTI Crude Oil (the CFD).
In our last Oil Trading Alert, we wrote:
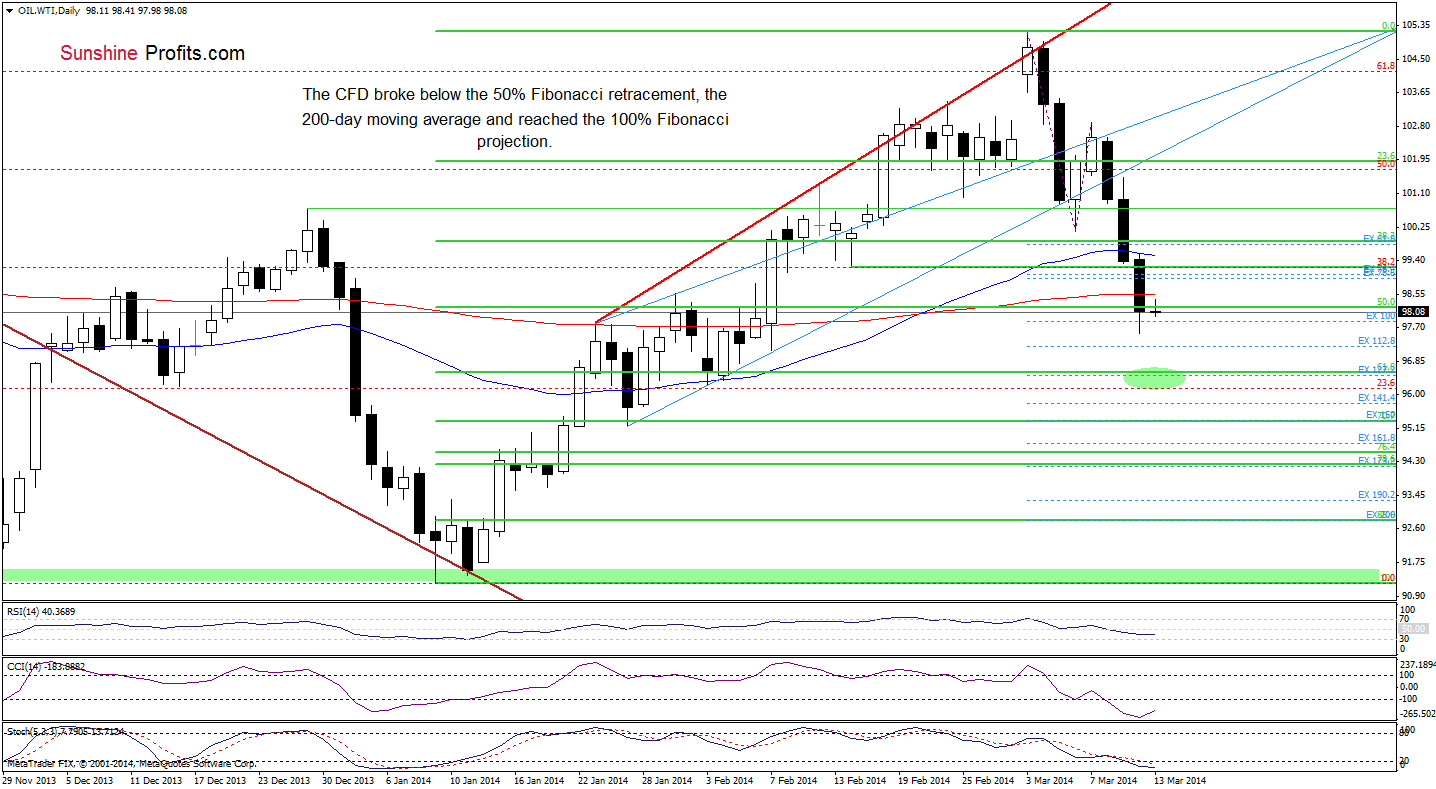
(…) a downward move (…) took the CFD to the 200-day moving average. (…) if it is broken, we will likely see further deterioration. Please note that the nearest support (the 50% Fibonacci retracement) is slightly below the current level and may pause (or stop) the current correction. However, taking into account the fact that the indicators still support sellers, we may see a drop to $97.84 (the 100% Fibonacci projection based on the 2014 and March 7 highs and March 6 low) or even to the 61.8% Fibonacci retracement (around $96.55) in the coming day (or days).
As you see on the daily chart, oil bears successfully pushed WTI Crude Oil below the 200-day moving average, which triggered further deterioration and a drop to the first downside target (the 100% Fibonacci projection). Although, the CFD moved little higher earlier today, it still remains below the 200-day moving average and the 50% Fibonacci retracement, which together create a strong resistance zone. From this perspective, it seems that as long as this resistance is in play, a bigger pullback is not likely to be seen and another attempt to move lower should not surprise us. Please note that if the CFD breaks below yesterday’s low, the next downside target will be the 61.8% Fibonacci retracement (around $96.55). Looking at the position of the indicators, we see that they still support sellers.
Summing up, crude oil extended losses and broke below two important support levels (the 50% Fibonacci retracement and the 50-day moving average), which is another bearish signal. Additionally, yesterday’s downswing materialized on huge volume, which confirms the strength of the sellers and suggests further deterioration to the next downside target in the coming day (or days). Please note that the current situation in WTI Crude Oil also suggests that bearish scenario is more likely at the moment (especially, if the CFD drops below yesterday’s low).
Very short-term outlook: bearish
Short-term outlook: mixed with bearish bias
MT outlook: bullish
LT outlook: mixed
Trading position (short-term): Short. Stop-loss orders for crude oil and WTI Crude Oil (CFD): $102.95. We will keep you informed should anything change as far as our opinion is concerned, or should we see a confirmation/invalidation of the above.
Thank you.
Nadia Simmons
Forex & Oil Trading Strategist
Forex Trading Alerts
Oil Investment Updates
Oil Trading Alerts
