
Oil Trading Alert originally sent to subscribers on February 27, 2014, 7:27 AM.
Trading position (short-term): In our opinion no positions are justified from the risk/reward perspective.
On Wednesday, crude oil gained 0.75% after the EIA data showed that crude inventories rose less than expected and better-than expected economic data. In this way, light crude rebounded and closed the day above $102 per barrel.
Yesterday, the U.S. Energy Information Administration showed in its weekly report that U.S. crude oil inventories rose by 68,000 barrels in the week ended Feb. 21, well below expectations for an increase of 1.24 million barrels. At this point it’s worth noting that although crude stockpiles grew for the sixth week in a row, it was the smallest weekly increase since June, suggesting that demand for crude may be stronger than the market expected. Additionally, crude stored in a major hub fell by 1.1 million barrels, which means that supplies at Cushing declined for a fourth straight week. All these numbers were bullish for the price of light crude and resulted in an increase above $102 per barrel.
Also yesterday, the Commerce Department showed that new home sales rose 9.6% to 468,000 units in January, while analysts had expected a 1% drop to 400,000. This largest increase in five-and-a-half years helped ease concerns over the strength of the U.S. economy after a series of disappointing economic data released earlier this month and also supported the price of crude oil.
Having discussed the above, let’s move on to the technical changes in the crude oil market (charts courtesy of http://stockcharts.com.)
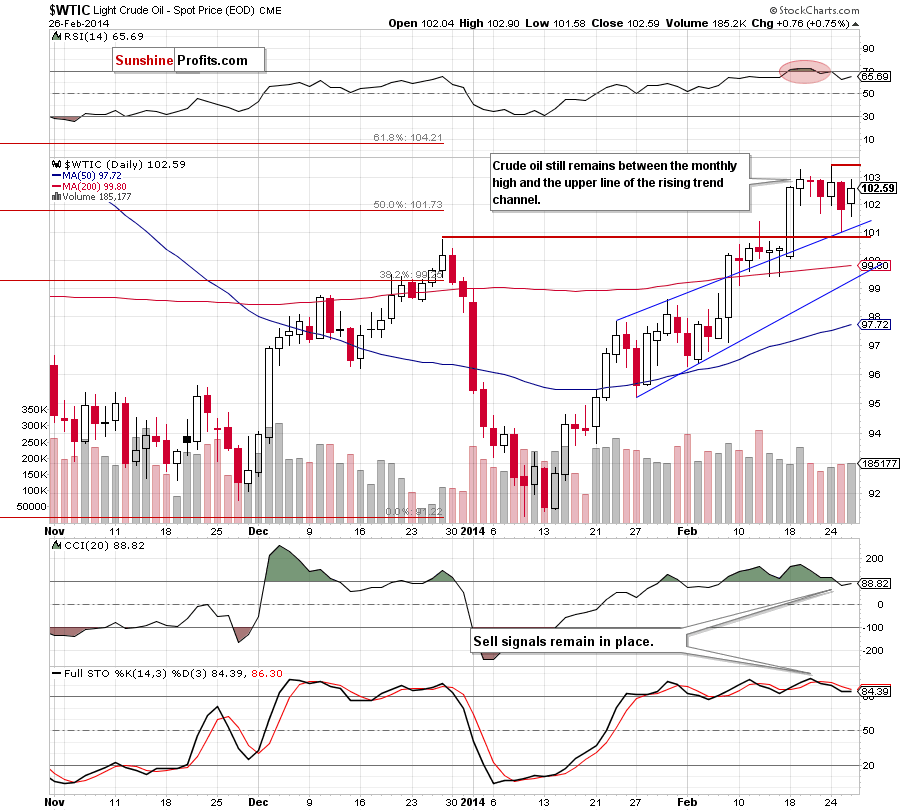
As you see on the above chart, although crude oil moved higher yesterday, it still remains in a narrow range (between the monthly high and the upper line of the rising trend channel) and the overall situation hasn’t changed much. As a reminder, the February high is reinforced by the 127.2% Fibonacci extension level based on the Dec.-Jan. decline (around $103.34), which serves as the nearest resistance level. The major short-term support is the upper line of the rising trend channel (and a support level created by the December high, slightly below this line). All sell signals generated by the indicators remain in place, supporting the bearish case. Connecting the dots, the very short-term situation is unclear and it is difficult to predict which way the next move will be. Therefore, it seems that as long as there is no breakout above the monthly high (or a breakdown below the upper line of the rising trend channel) a bigger upswing (or downswing) is not likely to be seen.
Having discussed the current situation in light crude, let’s take a look at WTI Crude Oil (the CFD).
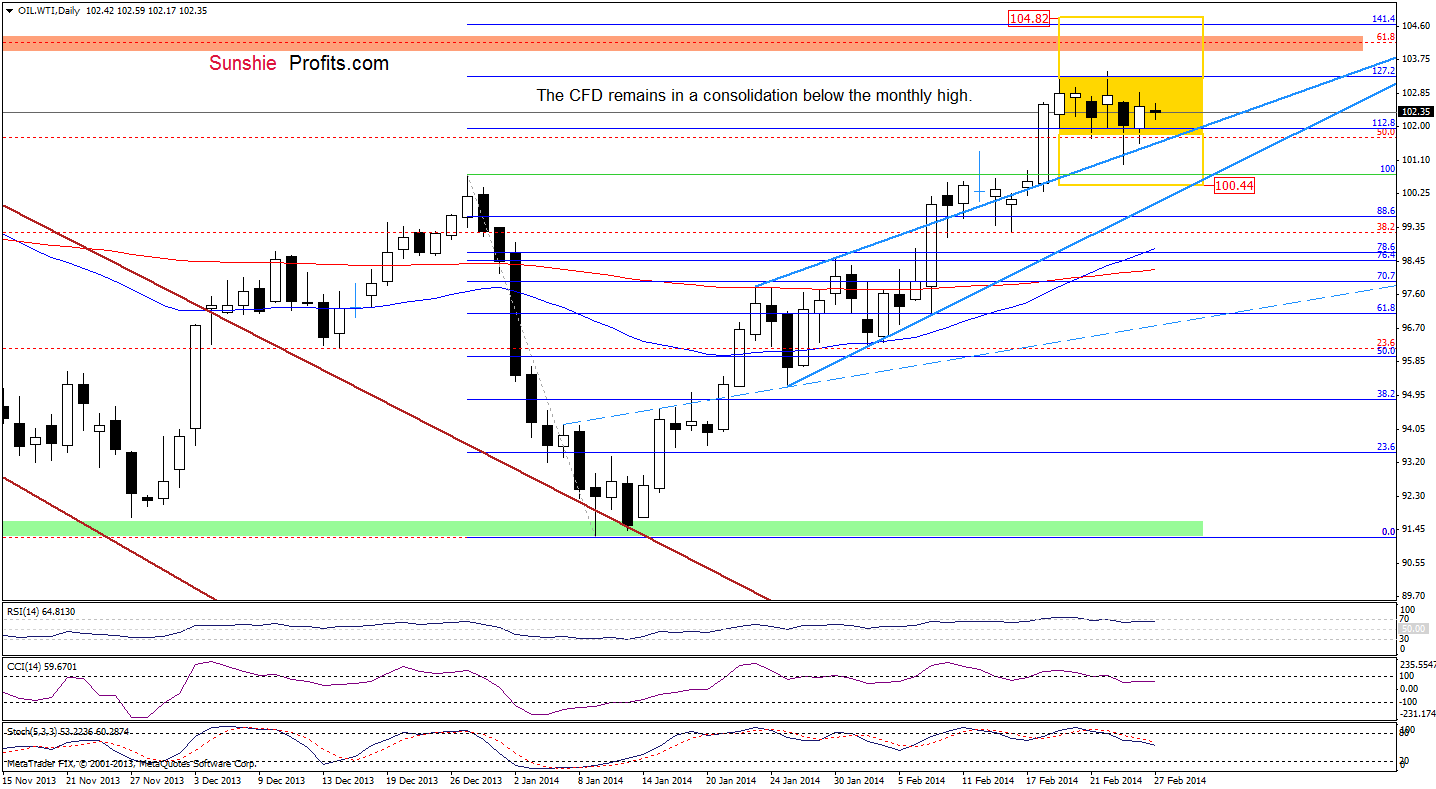
Looking at the above chart, we see that the situation hasn’t changed much as WTI Crude Oil still remains in a consolidation between the upper border of the rising trend channel/rising wedge and the February high. Similarly to what we wrote in the case of crude oil, it seems that as long as there is no breakout above the monthly high (or a breakdown below the major short-term support line) a bigger upswing (or downswing) is not likely to be seen.
Please note that the 127.2% Fibonacci extension level still serves as the nearest resistance and sell signals generated by all indicators remain in place, which favors sellers. Taking these facts into account, we should keep in mind the bearish scenario from the last Oil Trading Alert:
(…) the CFD is still trading in a consolidation range (marked with yellow). So, if we see a drop below the upper border of the rising trend channel/rising wedge, the next downside target for oil bears will likely be around $100.46, slightly above the Feb.18 low. As mentioned earlier, this scenario is still reinforced by the position of the indicators.
Nevertheless, if oil bulls do not give up and successfully push the CFD above the 127.2% Fibonacci extension, we may see an upswing to a resistance zone created by the Oct. high and the 61.8% Fibonacci retracement based on the entire Aug.-Jan. decline.
Summing up, the very short-term outlook for crude oil is unclear as light crude remains between the February high and the upper line of the rising trend channel. As mentioned earlier, as long as there is no breakout /breakdown above/below one of these important lines a bigger upswing (or downswing) is not likely to be seen. However, despite this unclarity, all sell signals generated by the indicators remain in place favoring oil bears, which suggests that another attempt to move lower should not surprise us.
Very short-term outlook: mixed
Short-term outlook: bullish
MT outlook: bullish
LT outlook: mixed
Trading position (short-term): In our opinion, the situation is too unclear to go short or long at the moment. So, no positions are justified from the risk/reward perspective. We will keep you informed should anything change, or should we see a confirmation/invalidation of the above.
Thank you.
Nadia Simmons
Forex & Oil Trading Strategist
Forex Trading Alerts
Oil Investment Updates
Oil Trading Alerts
