
Oil Trading Alert originally sent to subscribers on January 30, 2014, 9:32 AM.
Trading position (short-term): no positions.
On Wednesday, crude oil extended losses as the EIA data showed that crude inventories rose more than expected. Despite this drop, light crude reversed and erased some of the declines after the Fed decided to cut $10 billion from its bond-buying program. Thanks to these news, crude oil gained 0.06% and closed the day above $97 once again.
Yesterday, the U.S. Energy Information Administration showed in its weekly report that crude oil inventories rose by 6.4 million barrels to 357.6 million barrels in the week ended Jan. 24. (while analysts had expected a gain of 2.2 million barrels). This weekly supply increase was the largest since the week ended Oct. 4. Despite the larger-than-expected supply build, oil investors were encouraged by data, which showed that gasoline supplies declined by 800,000 barrels, while distillate inventories, including heating oil and diesel fuel, fell by 4.6 million barrels last week. According to what we wrote in our last Oil Trading Alert, colder-than-normal temperatures have boosted demand for heating oil and distillate stockpiles now stand 12.6% lower than a year earlier.
Also yesterday, the Fed changed very little in its statement from the previous month. Neither a disappointing December jobs report nor recent turmoil in emerging markets was enough to diminish their positive outlook for the U.S. economy. Therefore, the Fed's policy-making committee said in a statement that it would trim its bond purchases to $65 billion per month in February, from a monthly pace of $75 billion in January. At this point it’s worth noting, that (similarly to what we saw in December) we didn’t see declines in crude oil as the dollar strengthened on the news.
Having discussed the above, let’s move on to the technical changes in the crude oil market (charts courtesy of http://stockcharts.com.)
Quoting our last Oil Trading Alert:
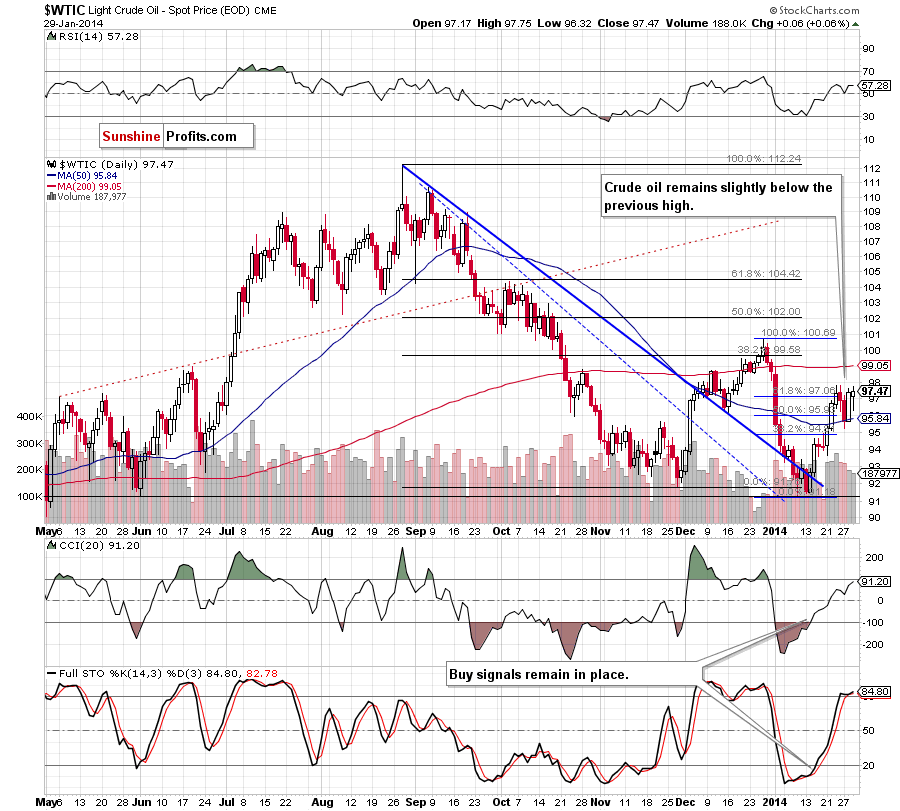
(…) light crude (…) approached the January high. Although this is a bullish sign, this upward corrective move materialized on relative low volume. Taking this fact into account, it seems that the buyers may not have enough strength to push the price higher at the moment. If this is the case, we may see another downswing and the first important support would be the 50-day moving average (currently at $95.77).
Looking at the above chart, we see although oil bears pushed the price lower after the market open, they didn’t even reached the 50-day moving average before crude oil reversed. This was a bullish signal, which encouraged buyers to act and triggered an corrective upswing that took the price to slightly below the Jan.23 high.
At this point, we should consider two scenarios. If the buyers do not manage to push the price higher, we will likely see a double top pattern. In this case, such bearish formation will likely encourage sellers to act and trigger another downswing (the downside target will be the 50-day moving average once again). On the other hand, taking into account the position of the indicators (buy signals remain in place supporting buyers), we may see another attempt to move higher. In this case, if oil bulls manage to push light crude above the Jan. 23 high, we will likely see further improvement and the upside target will be the 200-day moving average (currently at $99).
Having discussed the current situation in light crude, let’s take a look at WTI Crude Oil (the CFD).
Quoting our last Oil Trading Alert:
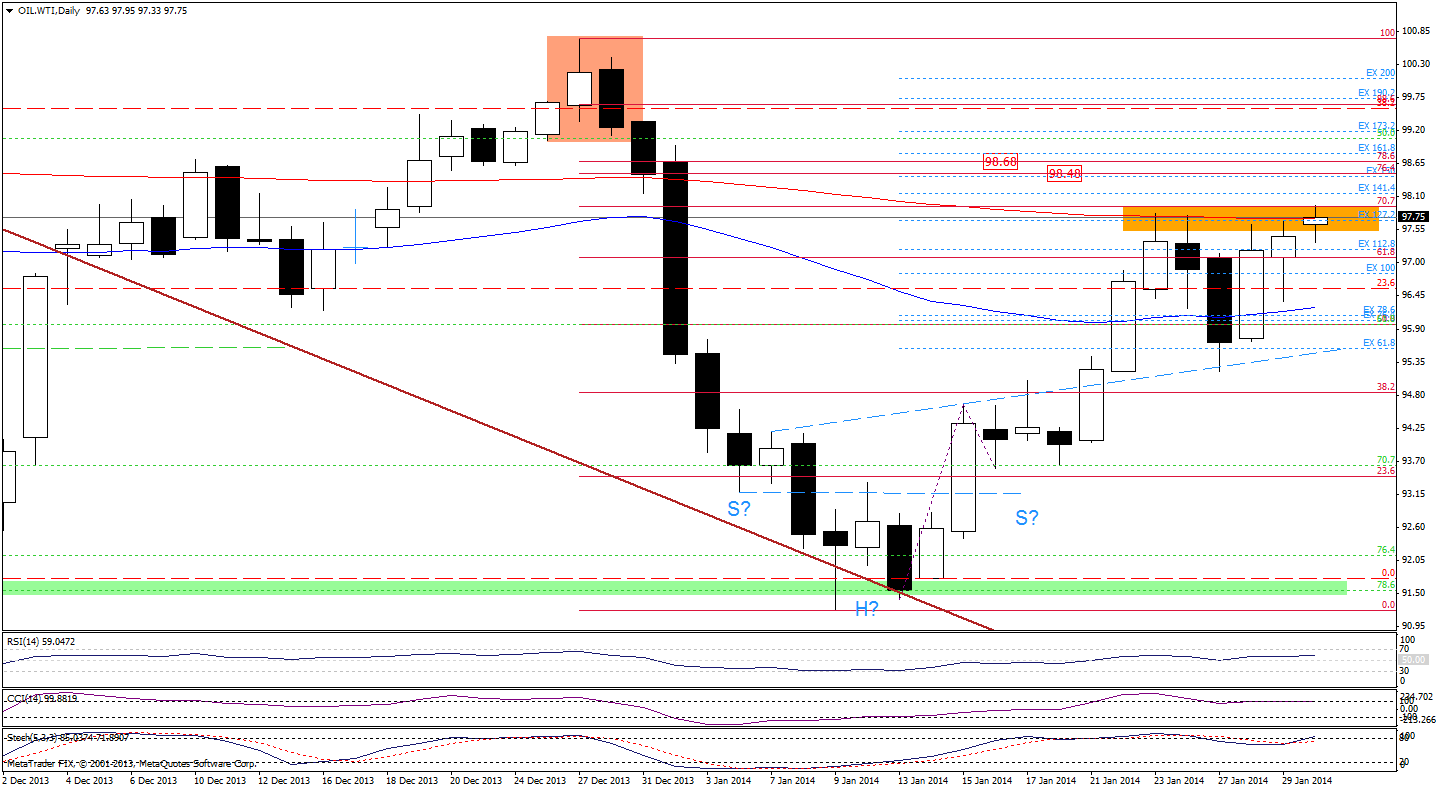
(…) the CFD (…) approached to the 200-day moving average once again. (…) this strong resistance (in combination with the 127.2% Fibonacci projection) stopped the buyers yesterday and it seems that as long as WTI Crude Oil remains below this strong resistance zone, further gains are limited. If this area encourages the sellers to act, we will likely see another downswing (especially when we factor in sell signals generated by the indicators) and the first downside target will be the 50-day moving average.
Looking at the above chart, we see that the CFD moved lower, but oil bears didn’t reach the 50-day moving average. The proximity to this support was enough to encourage buyers to act. They pushed the order button and triggered an upswing that took WTI Crude Oil to slightly below the previous highs. This was a bullish signal, which resulted in further improvement earlier today. As you see on the daily chart, oil bulls managed to push the CFD not only above the Jan.23 high, but also above the 200-day moving average and the 127.2% Fibonacci projection. This is a strong bullish signal and if the position of the indicators doesn’t encourage sellers to act, we will likely see further improvement. If this is the case, the upside price target will be around $98.47-$98.78 where the 76.4% and 78.6% Fibonacci retracements are.
Summing up, the situation hasn’t changed much as crude oil came back to slightly below the Jan.23 high and remains a bit unclear. As mentioned earlier, we can consider two scenarios at the moment. However, taking into account the position of the indicators (in the case of crude oil) and the breakout above the 200-day moving average (in the case of the CFD) it seems that we will likely see further improvement in the coming day (or days) and the upside target will be the 200-day moving average (currently at $99.05).
Very short-term outlook: mixed bullish bias
Short-term outlook: bullish
MT outlook: bullish
LT outlook: mixed
Trading position (short-term): Opening a long position here makes sense at the first sight, but after examining the expected profitability and comparing it with the risk associated with the position (stop-loss order would have to be placed quite far from the current price), we think that opening it is not a good idea. It's close to being favorable, but we don't view the risk/reward ratio as such.
Thank you.
Nadia Simmons
Forex & Oil Trading Strategist
Forex Trading Alerts
Oil Investment Updates
Oil Trading Alerts
