
Free Oil Trading Alert originally sent to subscribers on January 24, 2014, 8:35 AM.
Trading position (short-term): We might see a corrective move if crude oil invalidates the breakout above the 61.8% Fibonacci retracement level, so we suggest closing long positions and taking profits off the table.
On Thursday, crude oil gained 0.65% as the EIA data showed that U.S. distillates stockpiles dropped more than expected last week, despite gains posted in oil and gasoline inventories. Thanks to this news, light crude extended its gains and hit a fresh three-week high of $97.84 per barrel.
Yesterday, the U.S. Energy Information Administration said in its weekly report that U.S. crude oil inventories rose by 990,000 barrels in the week ended Jan. 17. Although this closely watched government inventory report showed that crude stockpiles climbed for the first time in eight weeks, the gain nearly met analysts' expectations (as a reminder, analysts expected that oil inventories rose by 1.2 million barrels last week).
The EIA report also showed that gasoline stockpiles rose by 2.1 million barrels last week, reaching their highest level since February 2011. Meanwhile, distillate supplies, including diesel fuel, declined by 3.2 million barrels (compared to expectation for a loss of 851,000 barrels), which supported the price of light crude and pushed it to its highest level in three weeks.
Having discussed the above, let’s move on to the technical changes in the crude oil market (charts courtesy of http://stockcharts.com.)
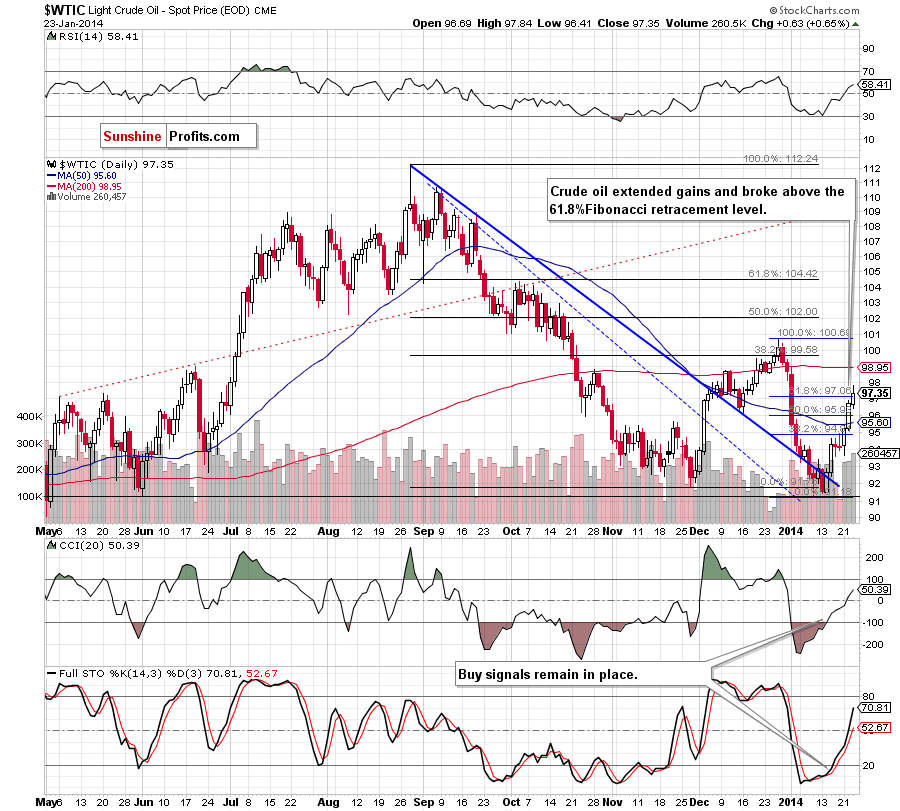
On the above chart, we see that crude oil extended gains and broke above the 61.8% Fibonacci retracement level. Thanks to this upswing (which is confirmed by another increase in volume), light crude hit a fresh 3-week high of $97.84 and approached the 70.7 Fibonacci retracement (around $97.96). Although this is not a very strong resistance level, it seems that after a three-day rally it could be enough to encourage oil bears to act. This assumption is reinforced by the Fibonacci price projection (based on the Jan. 13 and Jan 21 lows and the Jan. 15 high), which shows that the 100% projection is at $96.86 and suggests that the upside target was reached yesterday. Taking these facts into account, we will likely see a corrective move in the near future, but this potential correction will likely be limited by the 50-day moving average which serves as support.
Looking at the position of the indicators (they are not overbought, buy signals generated by the CCI and Stochastic Oscillator remain in place and the RSI is not overbought), it seems that this very short-term uptrend is not threatened and further improvement after a pullback is likely to be seen.
Having discussed the current situation in light crude, let’s take a look at WTI Crude Oil (the CFD).
Quoting our last Oil Trading Alert:
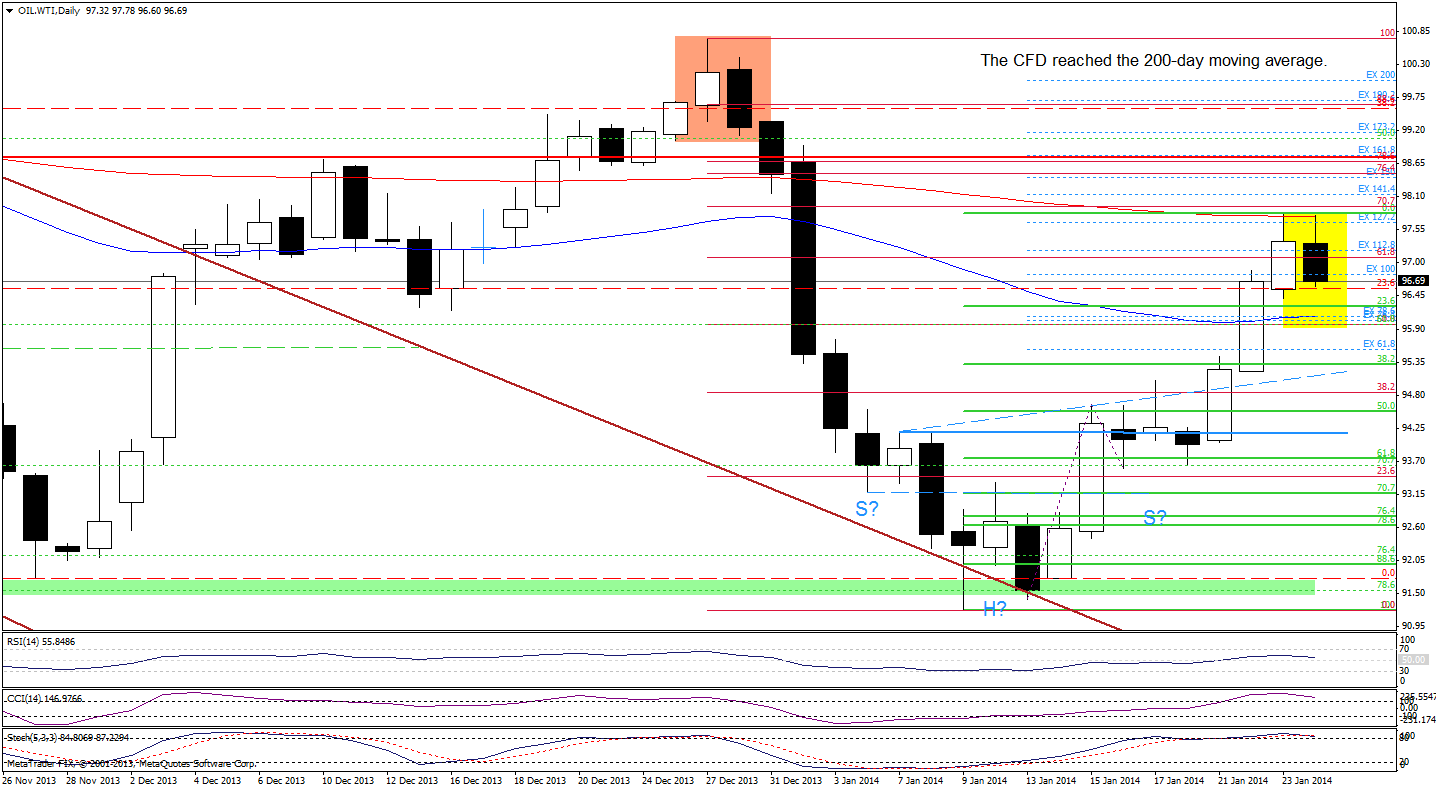
(…) the CFD broke above the 50-day moving average and approached the 61.8% Fibonacci retracement level (…) if it is broken, we will see further improvement and the next upside target will be around $97.70, where the 200-day moving average and the 127.2% projection are (slightly below the 70.7% Fibonacci retracement level).
On the above chart, we see that oil bulls managed to push the CFD higher yesterday. With this upswing, they realized their own pro-growth scenario and WTI Crude Oil reached its next upside price target. As you see on the daily chart, a strong resistance zone created by the 200-day moving average, the 127.2% projection and the 70.7% Fibonacci retracement level encouraged oil bears to trigger a corrective move earlier today.
Taking into account this strong resistance zone, the size of the recent rally and the position of the indicators, it seems that oil investors will likely lock in gains in the coming day (or days). From this point of view, we may see a pullback even to around the 38.2% Fibonacci retracement level based on the recent rally at $95.31. However, the first downside target for the sellers would be the previously-broken 50-day moving average which serves as support. Please note that as long as the CFD remains above this line, the very short-term trend is not threatened and further gains are likely to be seen.
Looking at the position of the indicators, we see that the CCI and Stochastic Oscillator are overbought and very close to generating sell signals which prescribe caution.
Summing up, crude oil extended gains and broke above the 61.8% Fibonacci retracement level. As mentioned earlier, this upswing materialized on large volume, which confirms the strength of the buyers and suggests that further improvement is likely to be seen. Nevertheless, after a sharp three-day rally we may see a pullback in the coming day (or days) – especially when we take into account the fact that crude oil reached the 100% Fibonacci projection and the current situation in the CFD (it reached the strong resistance zone and the indicators are very close to generate sell signals).
Very short-term outlook: bullish
Short-term outlook: bullish
MT outlook: bullish
LT outlook: mixed
Trading position (short-term): We might see a corrective move if crude oil invalidates the breakout above the 61.8% Fibonacci retracement level, so we suggest closing long positions and taking profits off the table. We will keep you informed should anything change, or should we see a confirmation/invalidation of the above.
Thank you.
Nadia Simmons
Forex & Oil Trading Strategist
Forex Trading Alerts
Oil Investment Updates
Oil Trading Alerts
