
Free Oil Trading Alert originally sent to subscribers on January 21, 2014, 10:27 AM.
Trading position (short-term): Long. Stop loss: $92.40.
On Tuesday, crude oil gained 1.21% as the report from the International Energy Agency and forecast from the International Monetary Fund pushed the price higher. In this way, light crude hit a three-week high and closed the day above $95 per barrel.
Yesterday, the International Energy Agency said in its monthly report that global oil demand is forecast to rise by 1.3 million barrels a day this year to 92.5 million barrels, compared to a previous estimate of 91.2 million barrels a day. The agency also added that oil supplies from the OPEC rose by 310,000 barrels a day to 29.82 million barrels in December, due to higher output in Saudi Arabia.
As mentioned earlier, the price of crude oil was also supported by the International Monetary Fund, which raised its forecast for global economic growth to 3.7% this year from a previous estimate of 3.6%.
This bullish news bolstered expectations for fuel and energy demand to increase and pushed crude oil to its three-week high above $95.
Having discussed the above, let’s move on to the technical changes in the crude oil market (charts courtesy of http://stockcharts.com.)
In our last Oil Trading Alert, we wrote the following:
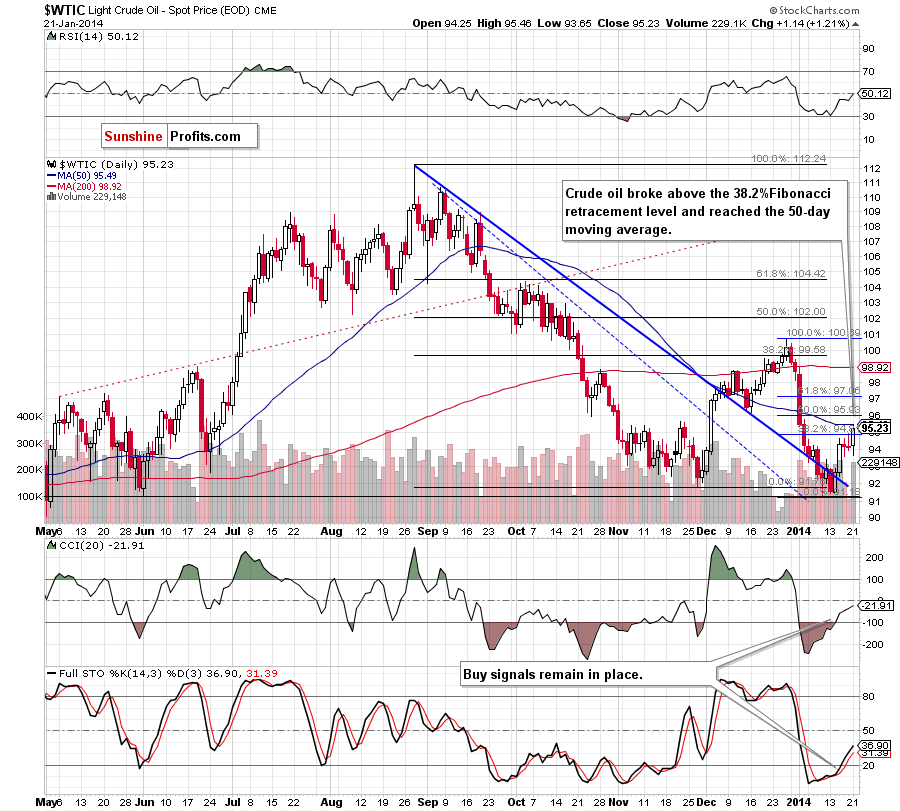
(…) Friday’s drop (similarly to Thursday’s decrease) materialized on tiny volume, so this downswing also seems to be insignificant. Additionally, buy signals generated by the indicators remain in place, supporting oil bulls (…) if the buyers successfully push the price above this level, we will likely see further improvement and the first upside target will be the previously-broken 50-day moving average.
Looking at the above chart, we see that crude oil rebounded sharply and broke above the 38.2% Fibonacci retracement level. What’s most important, this upswing materialized on large volume, which confirms the strength of the buyers and suggests that further improvement is likely to be seen in the coming day (or even days). As you see on the daily chart, with this upswing light crude also almost touched the 50-day moving average. Please note that although this resistance may encourage sellers to act, it seems that it would rather be a pause, not a bigger correction.
Before we discuss the current situation in WTI crude Oil, we would like to draw your attention to the most important improvement since yesterday’s market’s close.
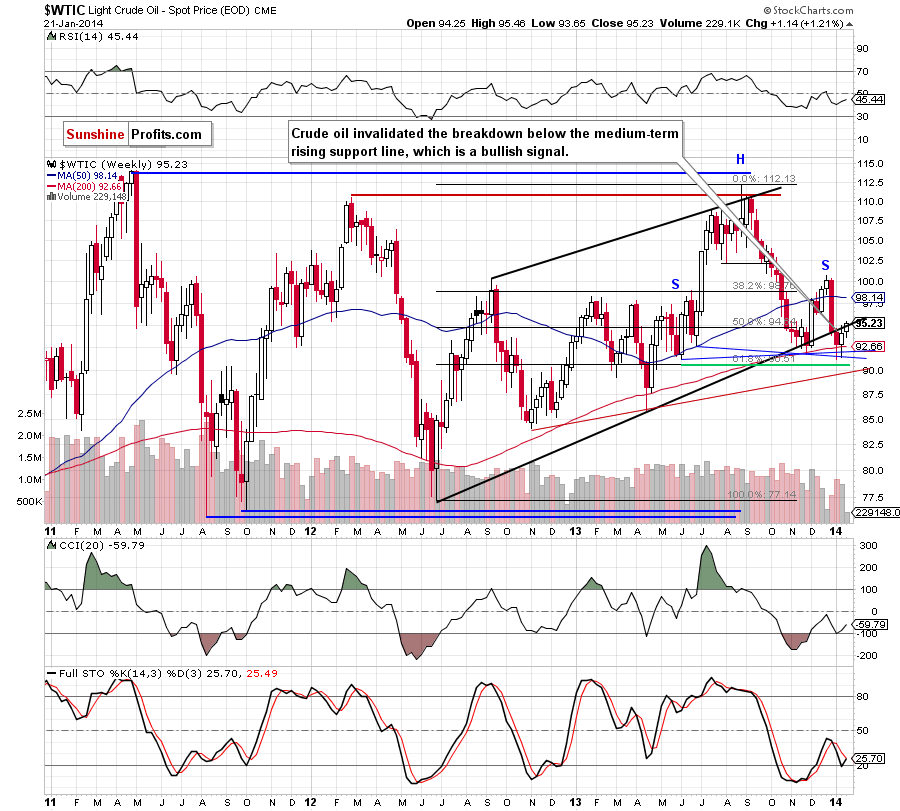
On the above chart, we see that crude oil came back above the previously-broken medium-term support/resistance line, which is a bullish signal. From this perspective, it seems that opening long positions is justified.
Having discussed the current situation in light crude, let’s take a look at WTI Crude Oil (the CFD).
Quoting our last Oil Trading Alert:
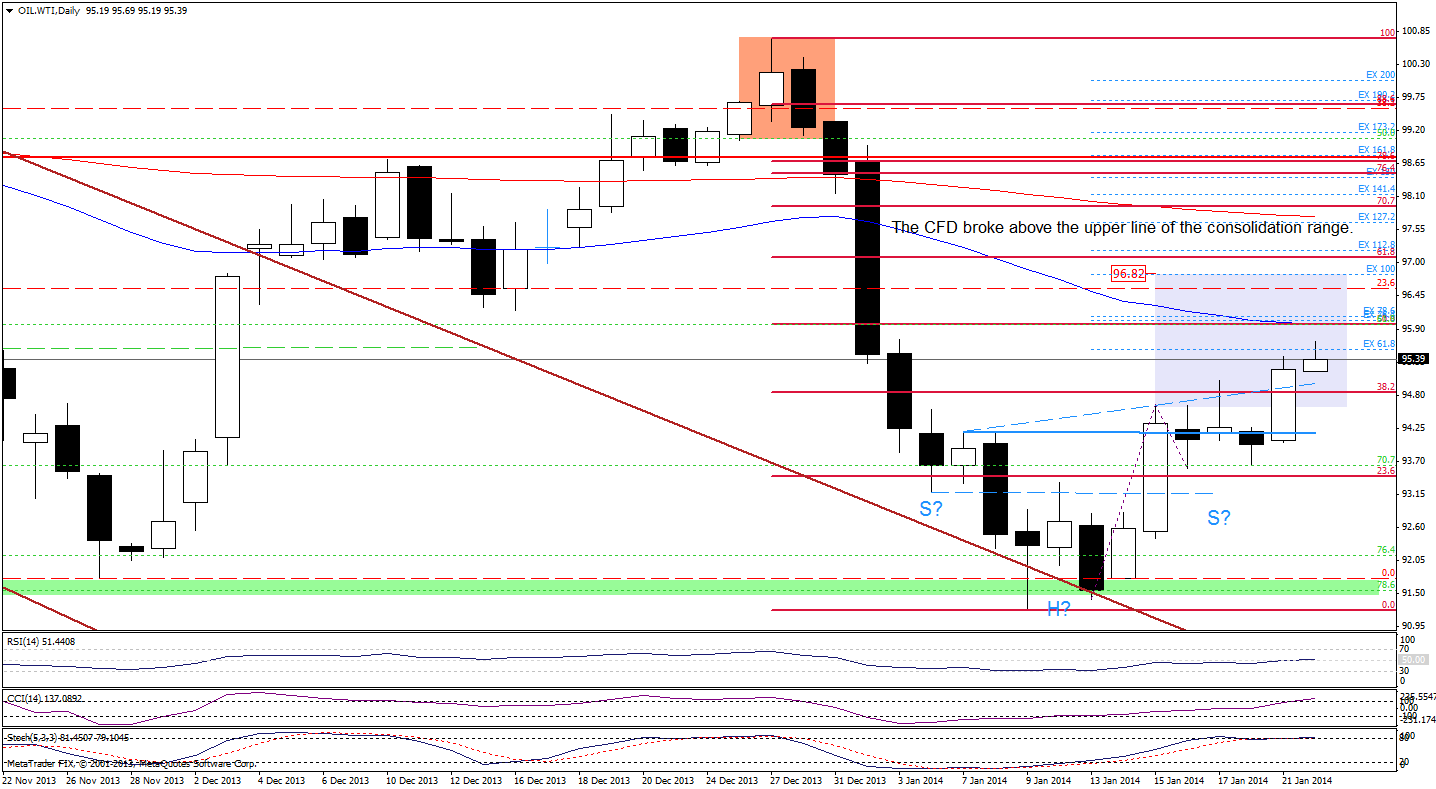
(…) as long as the CFD remains slightly below the upper line of a consolidation range, another attempt to move higher should not surprise us.
As you see on the above chart, we saw such price action yesterday. WTI Crude Oil rebounded sharply after a drop to the Jan. 16 low and not only erased the recent losses, but also broke above Friday’s high and the 38.2% Fibonacci retracement level. Thanks to this increase, the CFD also broke above the upper line of the consolidation range.
According to what we wrote in our Oil Trading Alert on Friday:
(…) recent days have formed a consolidation on the above chart. If the CFD breaks above (…) the 38.2% Fibonacci retracement level (…), we will likely see further improvement and the upside price target for this pattern will be around $96.76 (slightly below the 61.8% Fibonacci retracement).
When we factor in the Fibonacci price projections (based on the Jan. 13 and Jan.16 lows and the Jan. 15 high), we clearly see that the 100% projection intersects with the price target for the pattern, which suggests that further improvement is likely to be seen.
Looking at the position of the indicators, we see that the CCI and Stochastic Oscillator are overbought, but they didn’t generate sell signals and the RSI is not overbought, which supports the bullish case.
Once we know the above, let’s take a look at the NYSE Arca Oil Index (XOI) chart.
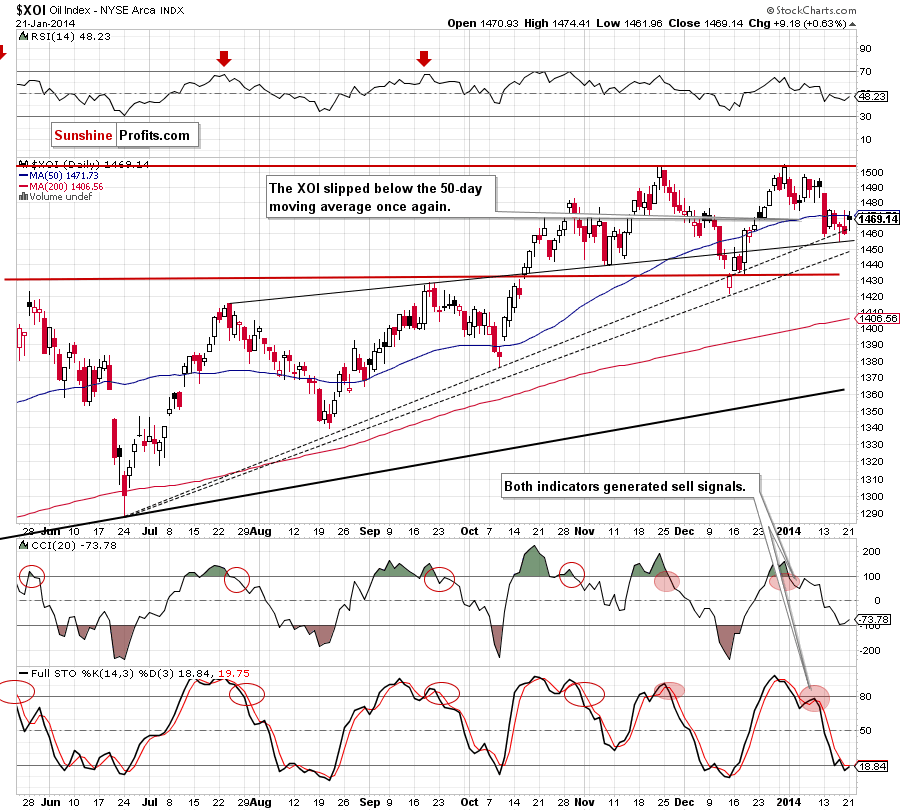
Looking at the above chart, we see that the situation hasn’t changed much as the oil stock index remains in a consolidation range between the Jan. 13 high (at ,485) and low (at 1,457). Although the sellers tried to push the XOI lower on Thursday, this attempt failed as the index bounced off the 61.8% Fibonacci retracement level and the upper line of the rising wedge (which is also the medium-term support line). On Friday, we saw further improvement, but the XOI quickly gave up the gains and declined below the 50-day moving average. Yesterday, we saw another attempt to move higher, but a strong resistance zone created by the Jan. 14 high (at 1,475) and the 50-day moving average successfully stopped further gains.
From this perspective, it seems that as long as the XOI remains below this strong resistance further improvement is unlikely and we may see price action similar to the one that we saw on Friday (another move lower). In this case, the nearest support would be Thursday’s low which intersects with the 61.8% Fibonacci retracement level and the upper line of the rising wedge (the medium-term support line). If it holds, we may see another rebound, but if this strong support is broken, the next downside target will be the medium-term rising support line based on the June and December lows (currently around 1,445). On the other hand, if this strong resistance is broken, we will likely see further improvement and the first upside target will be the Jan. 13 high at 1,485.
Summing up, crude oil rebounded sharply and broke above the 38.2% Fibonacci retracement level. As mentioned earlier, this upswing materialized on large volume, which confirms the strength of the buyers and suggests that further improvement is likely to be seen in the coming days. What’s most important, with this increase crude oil came back above the previously-broken medium-term support/resistance line, which is a strong bullish signal. From this perspective, it seems that opening long positions is justified.
Very short-term outlook: bullish
Short-term outlook: bullish
MT outlook: bullish
LT outlook: mixed
Trading position (short-term): We suggest opening long positions. Stop-loss order for this position: $92.40. Stop-loss order for WTI Crude Oil (CFD): $92.40. We will keep you informed should anything change, or should we see a confirmation/invalidation of the above.
Thank you.
Nadia Simmons
Forex & Oil Trading Strategist
Forex Trading Alerts
Oil Investment Updates
Oil Trading Alerts
