
Based on the June 3rd, 2014 Oil Investment Update
In our previous commentary, we took a look at the situation in the oil stocks index from the long-, medium- and the short-term perspectives to check whether the downward move that we noticed was a change in trend or just a correction. Back then, we wrote the following:
(…) Although the XOI reversed and declined to the psychological barrier of 1,600 in the previous week, it still remains above the previously-broken medium-term black line (which serves as support around 1,590 at the moment). Therefore, we think that as long as these important lines remain in play, the space for further declines is limited (…) the psychological barrier of 1,600 (…) if it holds, we will see a corrective upswing to around 1,623.
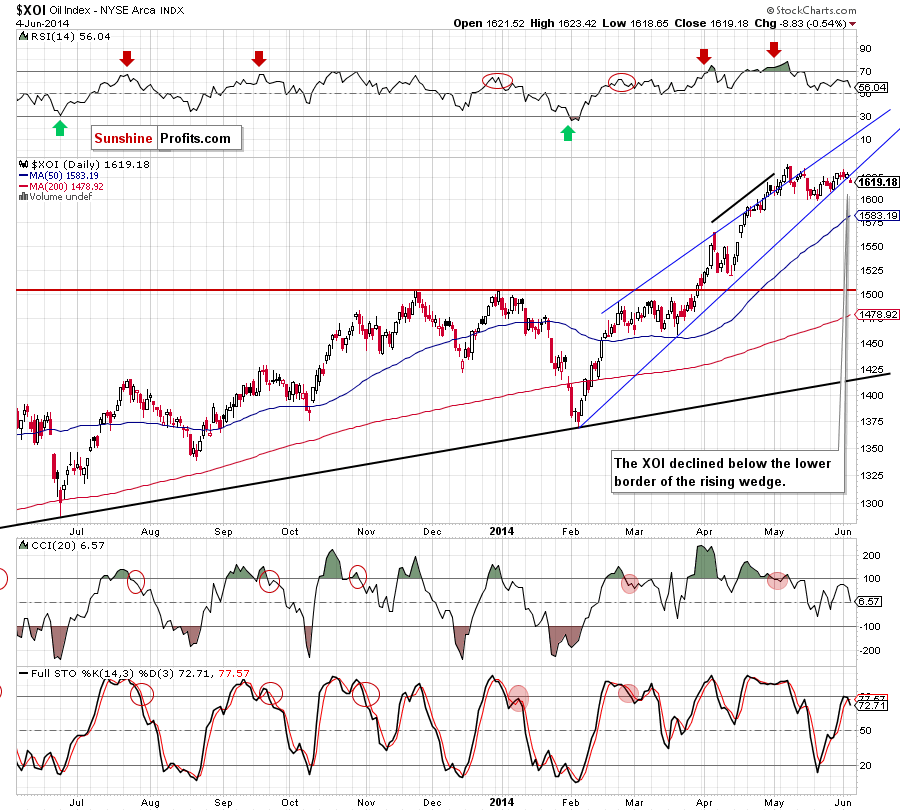
Since that essay was published, the oil stock index rebounded as the upward move erased almost all losses and took back the index to 1,633 (slightly below the May high). As it turned out, this resistance level encouraged oil bears to act and oil stocks declined below the lower border of the rising wedge yesterday. At this point, you may ask a question: one-day breakdown or something more?
Before we try to answer this question, we’ve decided to check not only the current picture of oil stocks, but also examine an interesting relationship to see if there's something else on the horizon that could drive oil stocks higher or lower in the near future. It seems there is. So, let’s focus on the connection between oil stocks and the general stock market (charts courtesy by http://stockcharts.com).
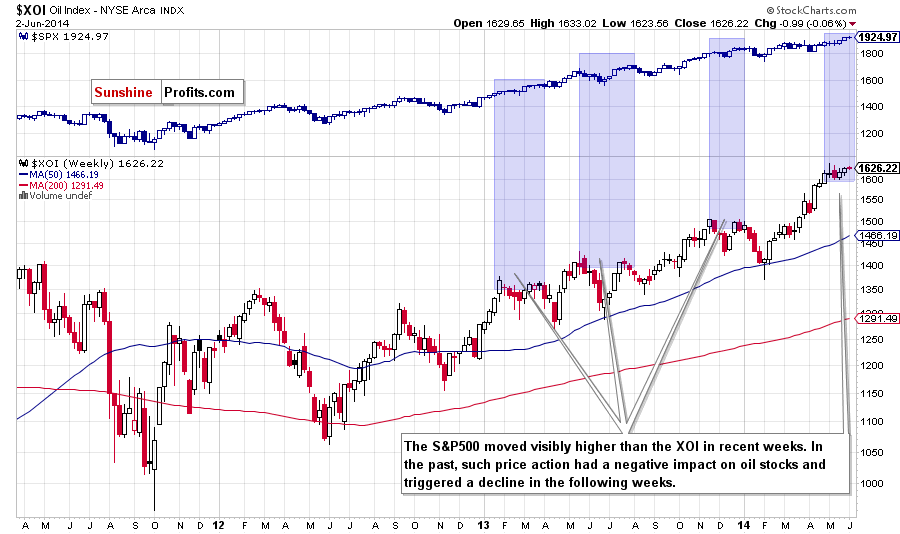
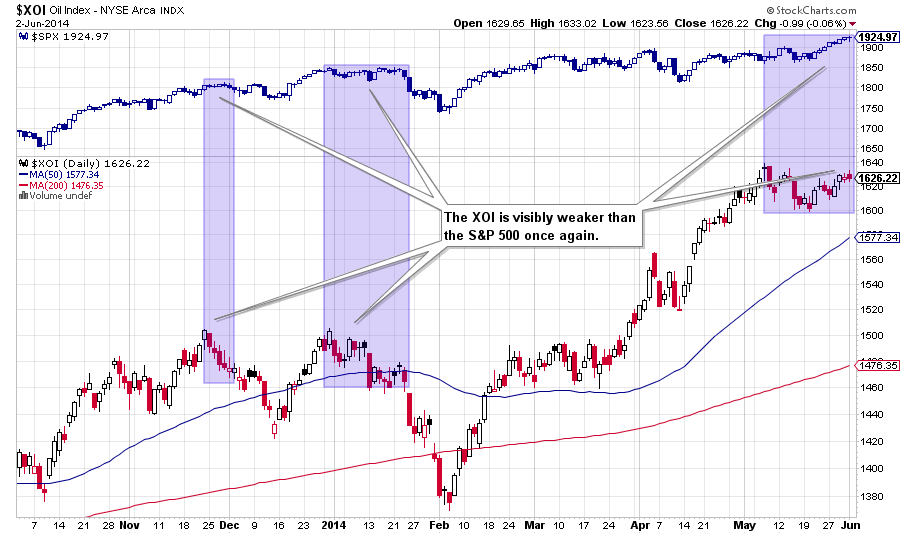
From both, the weekly and daily perspective, we see that oil stocks are visibly weaker once again. As you see on the above chart, we noticed similar price actions in the past. In earlier cases, such negative divergence had a negative impact on the XOI and trigered a decline in the following weeks. Therefore, we think that if history repeats itself once again, we’ll see further deterioration in the oil stocks index and the re-test of the strength of the key level of 1,600 in the following week (or weeks).
Does the technical picture of the oil stock index confirm the indications from the above-mentioned negative divergence? Let’s check, starting with the long-term chart.
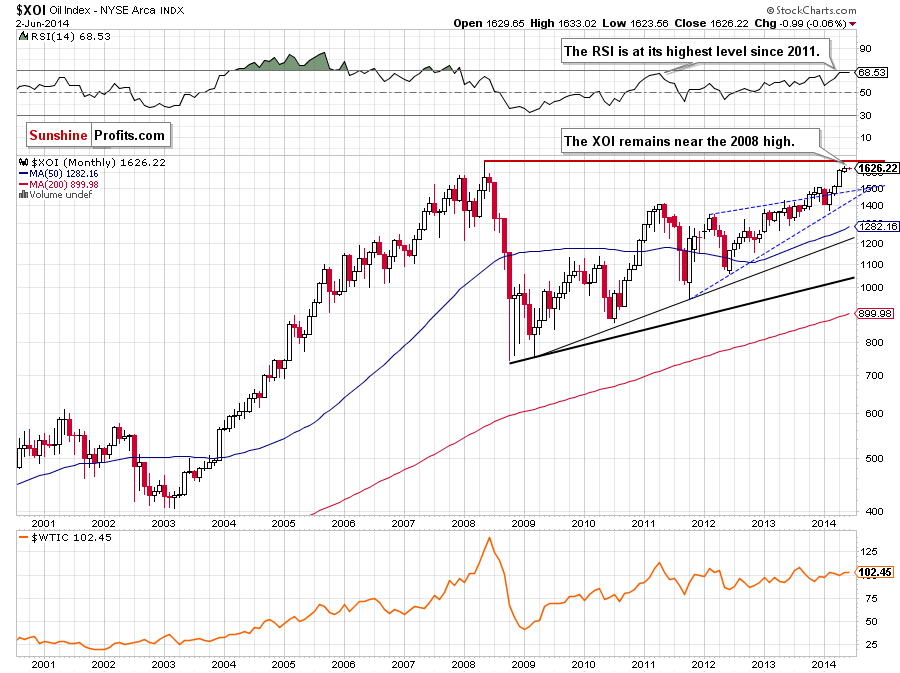
From this perspective, we see that the situation hasn’t changed much since our previous Oil Investment Update was posted as the XOI remains between the May high of 1,638 and the May low of 1,599. If the oil stock index moves higher from here, the upside target will be the 2008 high of 1,663. However, taking into account the fact that the RSI is at its highest level since 2011, it seems to us that a pause or pullback is likely to be seen.
Will the medium-term chart confirm this scenario? Let’s zoom in on our picture and move on to the weekly chart.
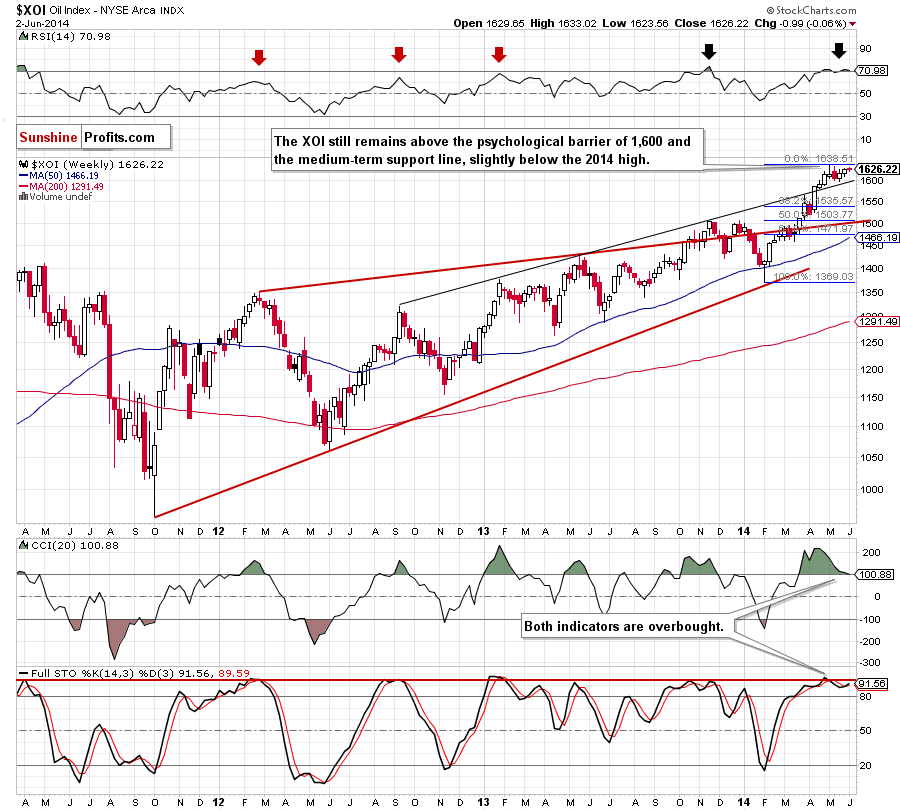
Quoting our essay posted on May 19:
(…) we don’t see any important technical resistance levels that could stop rally in the near future. However, when we take a closer look at the position of the indicators, the situation is not as bullish as it seems at the first glance. (…) there is a negative divergence between the CCI and the XOI, which is the first bearish signal. Additionally, the Stochastic Oscillator is at its highest level since the beginning of 2013, while the RSI broke above the level of 70. (…) similar circumstances predicted the trend reversal in the previous years (for example, in Sept. 2012, Jan. 2013 and also in Nov. 2013). Therefore, we think that if history repeat itself once again, we will likely see a correction in the coming week (or weeks).
As you see on the above chart, we noticed such price action in the first half of May as the XOI corrected, declining to the psychological barrier of 1,600. Despite this deterioration, this strong support encouraged investors to push the buy button, which resulted in an upward move that erased almost all losses and took back the oil stock index to slightly below the May high. What’s next? As we have pointed out before, from this perspective, we don’t see any important technical resistance levels that could stop rally in the near future. However, similarly to what we saw a month ago, a negative divergence between the CCI and the XOI remains in place, while the RSI came back above the level of 70. In our opinion, all the above suggests that we will likely see another downward move and a re-test of the strength of the key level of 1,600 in the coming weeks.
Having discussed the medium-term outlook, let’s turn to the daily chart.
In our previous commentary on oil stocks, we wrote the following:
(…) the RSI climbed to its highest level since the beginning of the previous month. Back then, even lower value of the indicator triggered a correction in the XOI (please note that we saw similar situations in October, November and also in December ). Additionally, the CCI and Stochastic Oscillator are overbought, which suggests that a correction is just around the corner.
Looking at the above chart, we see that all the above-mentioned bearish factors was strong enough to trigger a correction in the following days. As we mentioned earlier, the correction took the oil stock index to the psychological barrier of 1,600. From this perspective, we see that another supportive technical factor, which pushed the XOI higher was the lower border of the rising wedge (in our last Oil Investment Update we called this formation the rising trend channel, but taking into account the fact that both border lines are getting close to each other, the current definition seems to be more appropriate). At the end of the previous month, this line successfully stopped further deterioration and still serves as major short-term support.
As you see on the daily chart, at the beginning of the week, the XOI declined and reached this line once again. Yesterday, we noticed a breakdown, which suggests further deterioration. In opinion, if the breakdown is not invalidated, we’ll see a pullback to at least the key level of 1,600. If this area withstand the selling pressure, we’ll see a comeback to the lower border of the rising wedge, but if oil bears push the XOI lower, the next downside target will be the 50-day moving average (currently at 1,580).
Summing up, the long-term outlook is mixed as the XOI remains between last month’s high and low. From the medium-term perspective, the situation is quite bullish as we don’t see any important technical resistance levels that could stop rally in the near future. However, the current position of the indicators suggests that further deterioration is just around the corner, which should raise the attention of oil stocks holders – especially when we factor in the fact that oil stocks dropped below the lower border of the rising wedge marked on the daily chart.
Thank you.
Nadia Simmons
Forex & Oil Trading Strategist
Forex Trading Alerts
Oil Investment Updates
Oil Trading Alerts
