
Welcome! My name is Nadia Simmons and I’d like to introduce you to the technical side of the oil market. As a contributor for Sunshine Profits I’ll share my knowledge and I hope that my technical point of view will help you better understand the current market situation and future predictions. I invite you to read my daily commentary and… may the profits be with you.
In the past week we could read pieces in newspapers and see the wise guys on television talking about the price of gold and wondering where the bottom is. Personally, I think we have missed something interesting in this excitement.
After Fed Chairman Ben Bernanke's announcement commodities declined and pessimism transpired to the precious metals markets. We saw new 2013 lows in gold and silver but the U.S. dollar's strength wasn't as strong a blow to crude oil. Since the beginning of last week we could see further declines in these precious metals which pulled them to their lowest levels since 2010. Meanwhile crude oil not only escaped the carnage but was also pushed to its highest levels since the June top.
This surprising surge in crude oil encouraged me to take a closer look at the charts.
Let’s take a look at the technical side of the market and turn to the daily Brent crude oil chart.
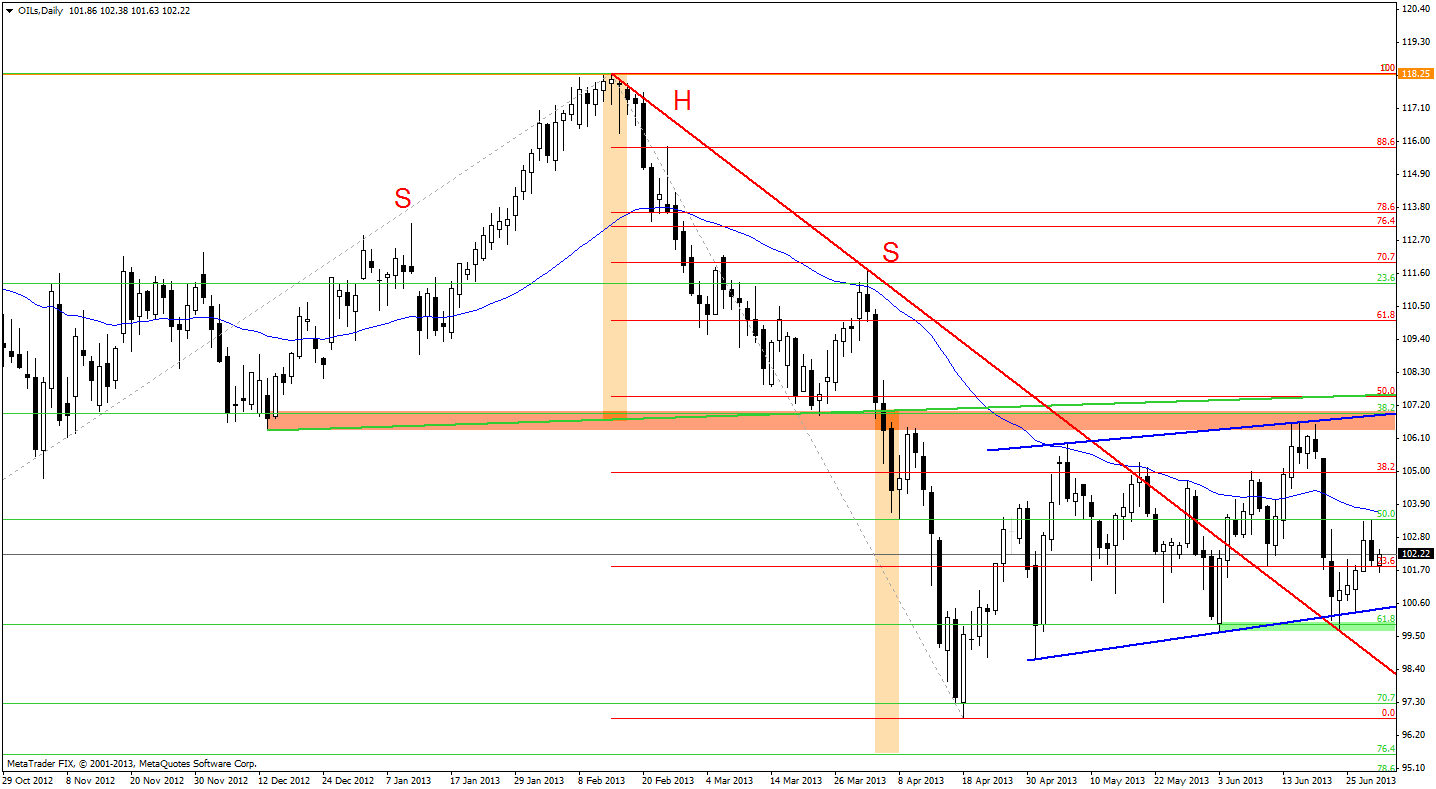
We hit off with a short recap of what’s been going on with oil recently. On April 4 there was a strong breakout which triggered a bearish head-and-shoulders formation. Since then oil bears could've been feeling good about themselves. Brent declined heavily in April and bottomed just below the Fibonacci retracement level, moving higher afterwards. The following days brought a bigger pullback and the price climbed up to over $106 per barrel on June 17. The strong resistance zone stopped the rally and the price went down once again.
As you can see on the above chart, last Monday we saw a re-test of the blue support line. Even though there had been an intraday breakout the bulls didn't give up and the price stopped just above the June bottom. That spurred the buyers and initiated a move to the upside. In the following days Brent rose, gaining over $103 on Friday in early European trade. In spite of the move being to the upside, it’s hard to take such a small increase (less than $4) as a sign of improvement. The outlook continues to be bearish and it seems that further declines will be seen relatively soon. The most important factor on the above chart supporting the bearish case is the previously mentioned head-and-shoulders pattern which could still be completed if Brent declines below the blue support line and the green support zone.
The trading channel and the support zone intersect at a point much lower than where this price is today which doesn't paint a positive picture. When we figure in the 50-day moving average, which was broken on June 20 once again and now serves as resistance, we clearly see that these factors make the previously mentioned target level a very important one.
Now let’s move on to the analysis of the light crude chart.
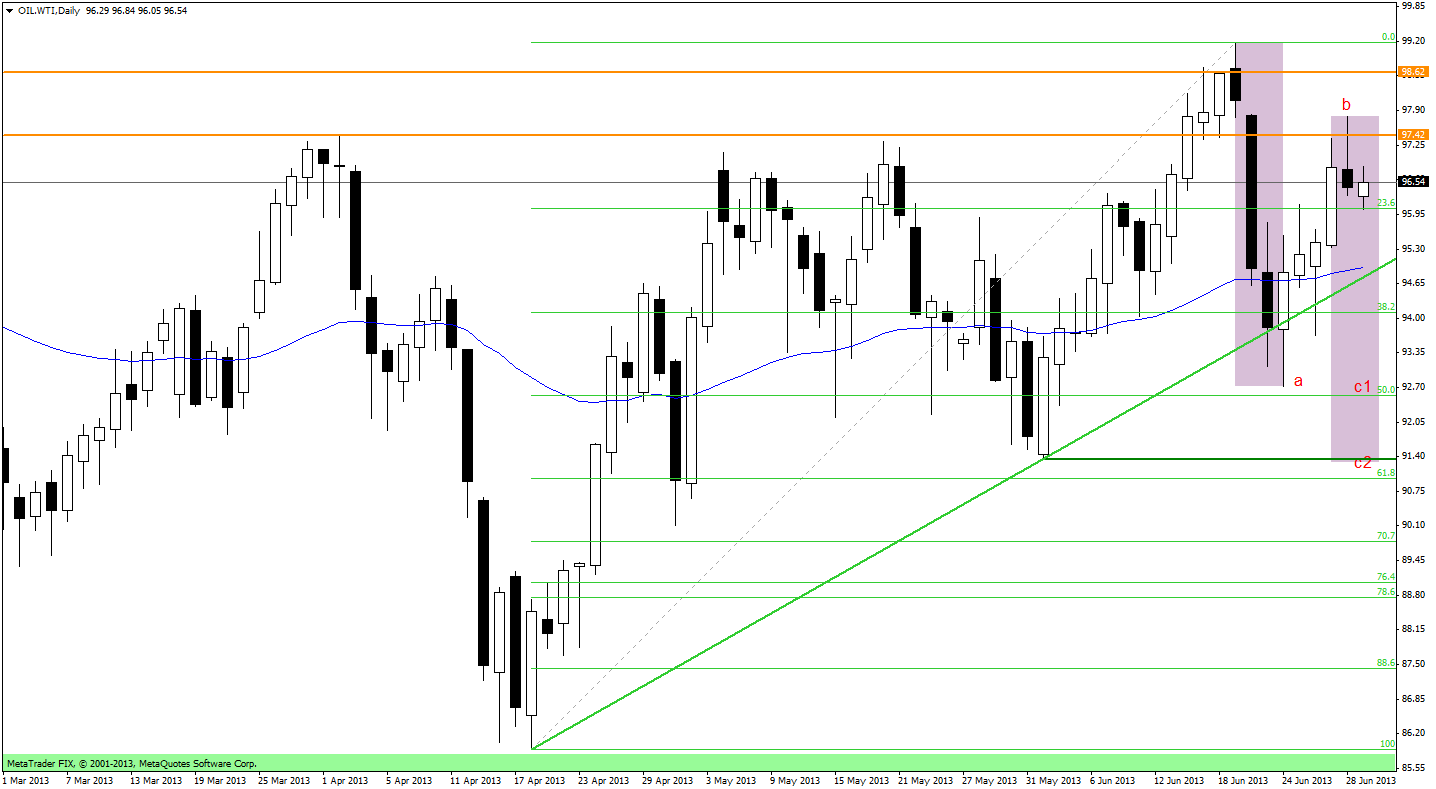
In this daily chart, we see that light crude started its short-time rally last Monday after it fell under $93 to its lowest level since June 19. As you see, the price bottomed just above the Fibonacci retracement level and then moved higher. The next days were also positive for buyers and more moves to the upside occurred. It was the longest increase since April and the price reached $97.80 a barrel. On a side note, notice that the intra-day high last Friday was lower than the previous one and from this perspective the declines clearly keep going on. Bear in mind, that there is a strong resistance zone based on the February and April heights (the orange horizontal lines) and that light crude ended the whole week below it which doesn't paint a positive picture. It seems that a further decline is now more likely than not. The first target for the bears is the medium-term support line based on the April and June bottoms. It is possible that this line will stop the decline, at least for a while, but if it is broken, the price may drop below $93 once again.
As mentioned before, there is a support zone which is additionally backed up by the 50 percent Fibonacci retracement level and this zone may stop further declines. On the other hand, we must consider a different scenario. An analogy to the previous decline suggests a move to lower levels here. In this case the next target level seems to be slightly below the June bottom where we can also see a consecutive Fibonacci retracement level (61.8%).
To finish off, let’s summarize and try to answer the question: what’s ahead for crude oil?
The technical situation on the analyzed charts is still bearish. They suggest that we will see lower prices. The reason for this is that the major support levels are lower than today’s prices, so there is still much room for further declines in the coming days.
Before we start looking for some bullish confirmation, Brent should at least break the 50-day moving average, which now serves as resistance. From this point of view the price of light crude should beat its June top and negate the importance of the strong resistance level. I think that investors should take the above inferences into consideration while making their investment plans for the future.
Thank you,
Nadia Simmons
Back